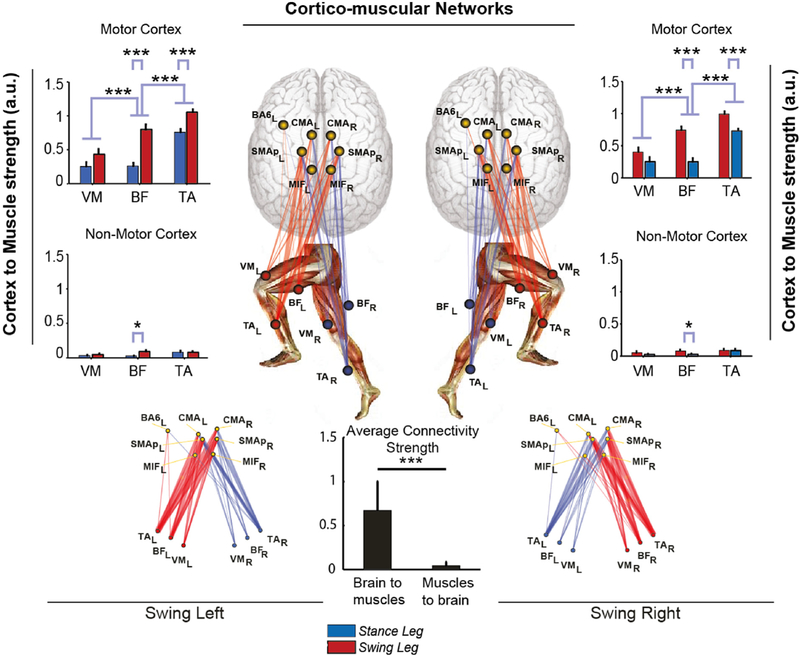
Fig. 7. Cortico-muscular connectivity.
Sum of connectivity strengths between ICs localized to cortical ROIs and recorded leg muscles In the Swing phase of left and right legs, respectively, during VTr = 3.5 km/h treadmill walking. Connectivity strengths are shown separately for Motor-related and Non-Motor related ROIs. (Center) Graphs showing brain-to-muscle effective connectivity networks in the Swing phase for each leg. Brain and muscle connections are shown in red and blue, red indicating the leg not contacting, and blue, the leg contacting the ground in the gait phase considered. Thicknesses of the connection lines are proportional to connectivity strength. Links with strengths ≤ 5% of the maximum network connectivity value are not shown. (Center Bottom) Average strength of brain-to-muscle vs. muscle-to-brain connections. Here data are pooled from both legs and swing phases. *p < 0.05; **p < 0.01; ***p < 0.001. Brain-to-muscle connectivity is significantly stronger than muscle-to-brain connectivity. Motor areas ROIs (especially cingulate motor cortex, posterior supplementary motor area, and primary foot motor cortex) have stronger causal influence on lower limb muscle signals than non-motor areas ROIs, also more pronounced in the swing leg and strongest to the Tibialis Anterior – TA, followed by the Biceps Femoris – BF, and Vastus Medialis – VM.

