Figure 1.
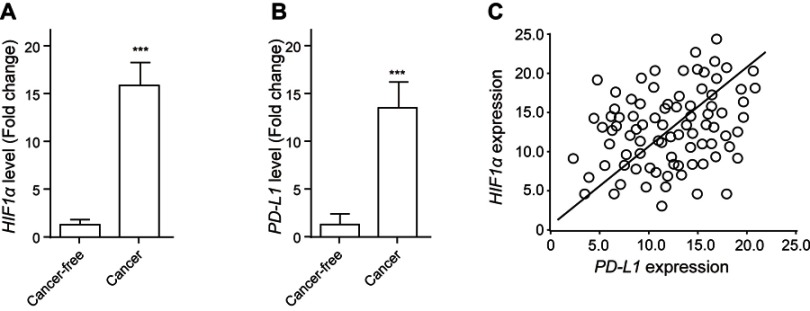
Increased expressions of HIF1α and PD-L1 in FTC tissue. The expression levels of HIF1α (A) and PD-L1 (B) in FTC tissue and in cancer-free tissue were analyzed using qRT-PCR. (C) Spearman correlation analysis was performed to clarify the relationships between HIF1α and PD-L1 expression. Data presented as mean ± SD, ***p<0.001.
Abbreviations: HIF-1α, hypoxia-inducible factor 1α; PD-L1, programmed cell death-1 protein ligand 1.

