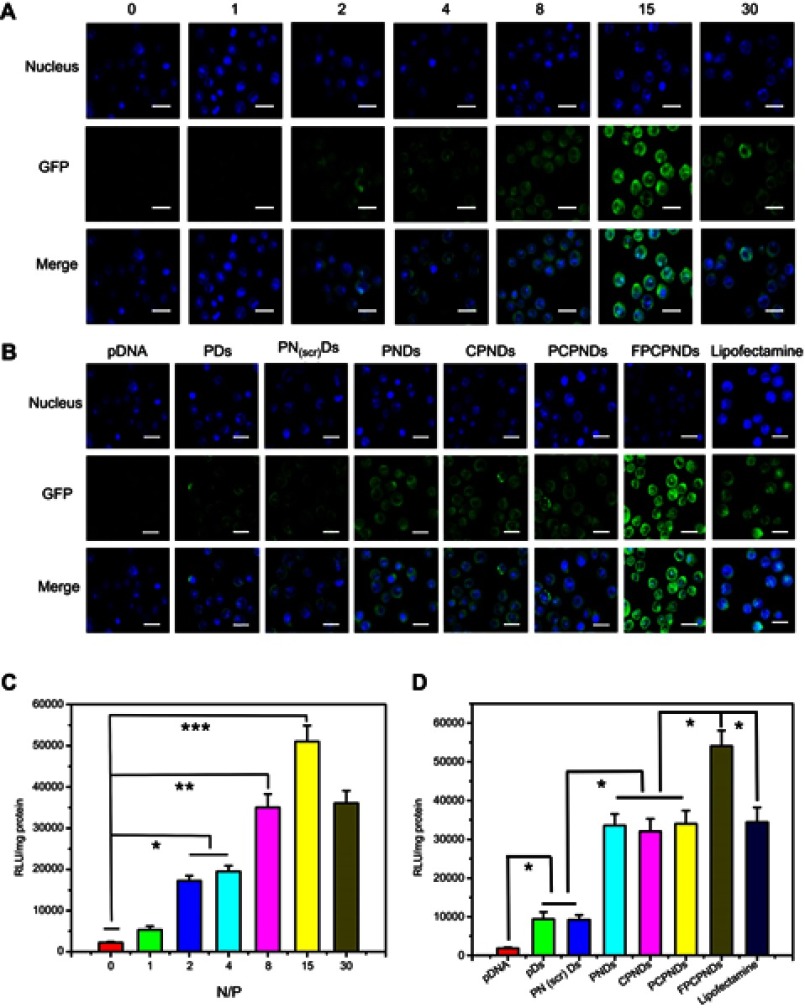
Figure 7.
In vitro transfection and expression of GFP was analyzed by LSCM and luciferase activity in 4T1 cells. (A, C) FPCPNDs at different N/P ratios for 24 hrs. (B, D) Different complexes at an N/P ratio of 15 for 24 hrs. Results were expressed as mean ± SD (n=3). *P<0.05, **P<0.01, and ***P<0.001. Scale bars =40 µm.
Abbreviations: FPCPNDs, FA-PEG-CCTS/PEI/NLS/pDNA; PND, PEI/NLS/pDNA; PDs, PEI/pDNA; PCPNDs, PEG-CCTS/PEI/NLS/pDNA; CPNDs, CCTS/PEI/NLS/pDNA; FA, folate acid; PEG, polyethylene glycol; CCTS, carboxylated chitosan; PEI, polyethyleneimine; NLS, nuclear localization sequences; GFP, green fluorescence protein; LSCM, laser scan confocal microscope.

