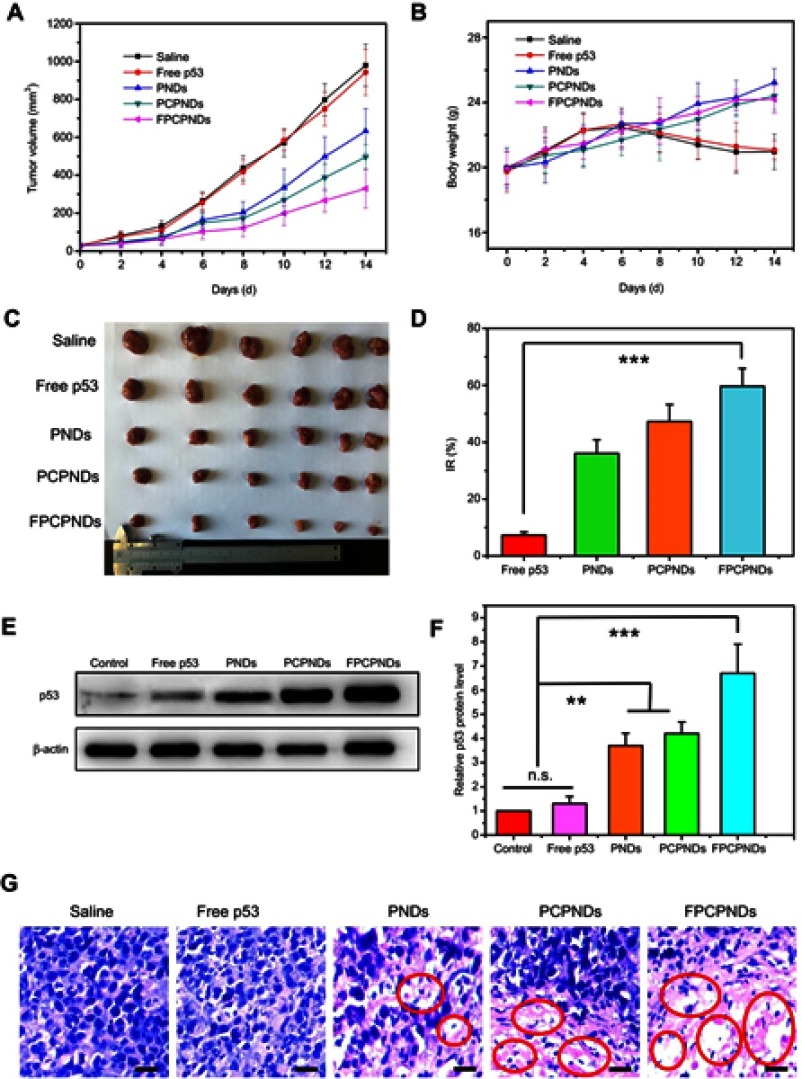
Figure 10.
In vivo antitumor activity. The mean (A) tumor volume, (B) body weight, (C) tumor graph and (D) inhibition rate of BALB/c mice bearing 4T1 tumor xenografts, after intravenous administration of saline, free p53, PNDs, PCPNDs and FPCPNDs (n=6). (E, F) Western blotting analysis of p53 protein expression in tumor xenografts transfected with different formulations, while tumors treated with PBS were served as control. (G) H&E staining of tumors of different groups. Blue and pink represent nucleic and cytoplasm, respectively. Red circle indicated apoptosis/necrosis regions and scale bars represent 100 μm. **P<0.01 and ***P<0.001.
Abbreviations: FPCPNDs, FA-PEG-CCTS/PEI/NLS/pDNA; PND, PEI/NLS/pDNA; PCPNDs, PEG-CCTS/PEI/NLS/pDNA; FA, folate acid; PEG, polyethylene glycol; CCTS, carboxylated chitosan; PEI, polyethyleneimine; NLS, nuclear localization sequences; n.s., not significant.

