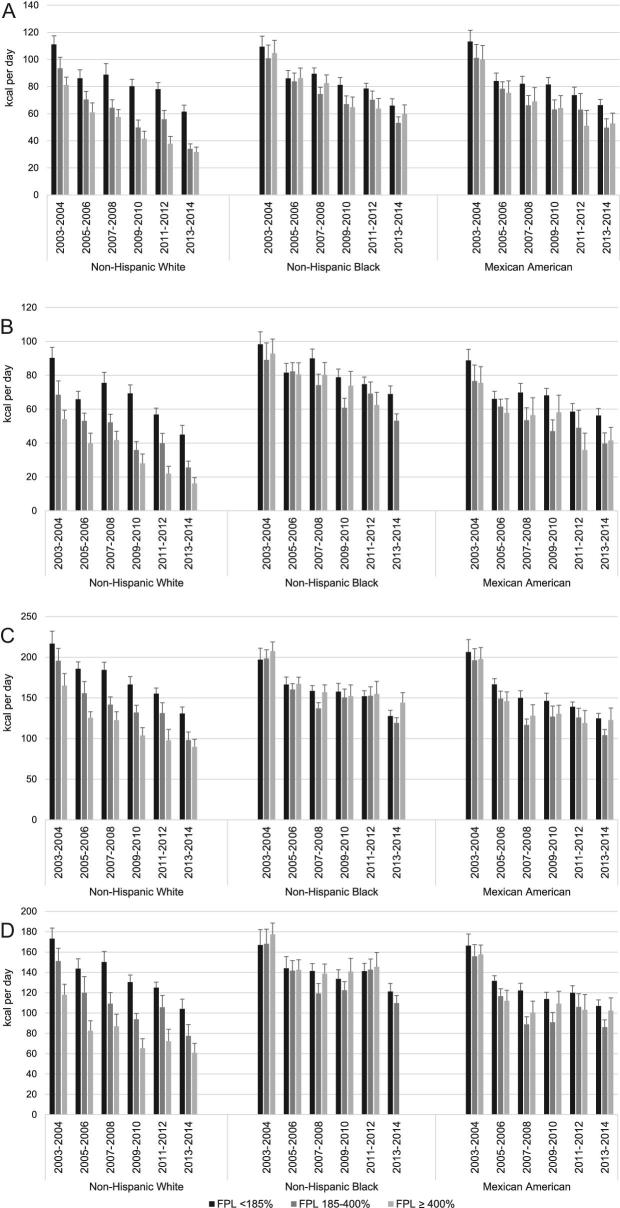
FIGURE 3.
Regular soda intake by race/ethnicity and household income as a percentage of poverty in participants aged 12–18 y (usual intake quantile regression results). Regular soda intakes of males aged 12–18 y (50th percentile) (A), females aged 12–18 y (50th percentile) (B), males aged 12–18 y (90th percentile) (C), and females aged 12–18 y (90th percentile) (D). Values are predicted intakes from multivariable-adjusted quantile regression (for details, see Supplemental Table 4), which found significant (*P < 0.05, †P < 0.01, ‡P < 0.001) associations with the following. Panels A and B—50th percentile, regular soda: 1) main effects: NHB‡; 12–18 y‡; male sex‡; income >400% FPL*; survey waves 2005–2006‡, 2007–2008*, 2009–2010‡, 2011–2012‡, and 2013–2014‡; 2) survey wave interactions: male × 2005–2006*, 2007–2008*, 2009–2010†, 2011–2012†, and 2013–2014‡; 12–18 y × 2005–2006‡, 2007–2008‡, 2009–2010‡, 2011–2012‡, and 2013–2014‡; 3) other interactions: male × 12–18 y‡, NHB × male‡, NHB × 12–18 y‡. Panels C and D—90th percentile, regular soda: 1) main effects: NHB‡; 12–18 y‡; male sex‡, income >400% FPL†; survey waves 2005–2006†, 2007–2008†, 2009–2010‡, 2011–2012‡, and 2013–2014‡; 2) income interactions: MA × income >400% FPL*, NHB × income >400% FPL†; 3) survey wave interactions: NHB × 2009–2010*, 2011–2012†, 2013–2014‡; 12–18 y × 2005–2006†, 2007–2008‡, 2009–2010‡, 2011–2012‡, and 2013–2014‡; 4) other interactions: 12–18 y × male‡, NHB × male‡, MA × 12–18 y†, NHB × 12–18 y‡. FPL, federal poverty level; MA, Mexican American; NHB, non-Hispanic black.

