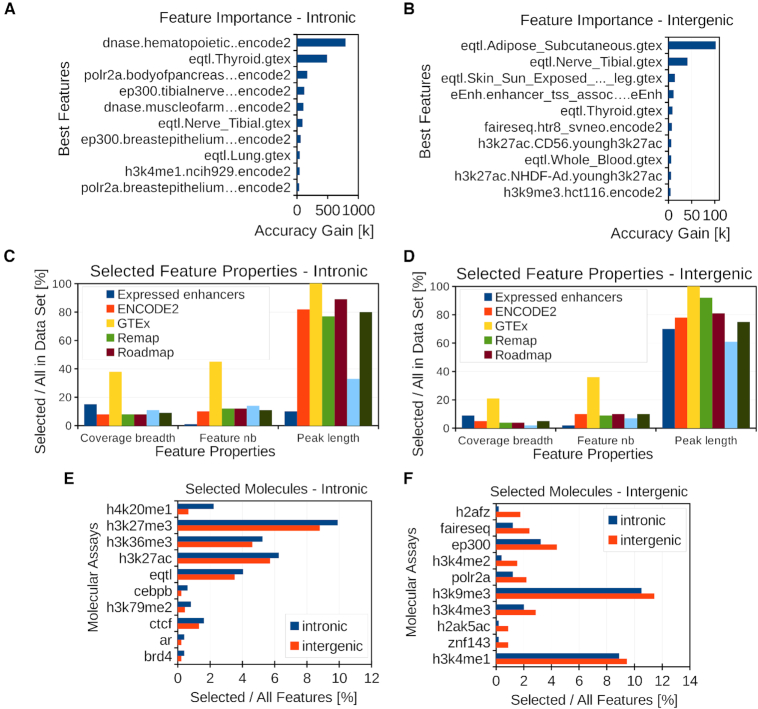
Figure 2.
Analysis of selected features. (A, B) Best ten predictor features in the intronic and intergenic models assessed by the XGBOOST gain feature importance type. The gain feature importance represents the average accuracy gain brought by a feature to the branches it is on. (C, D) Percentage of total length, feature number and average peak length between selected and initial features for given data sets in the intronic and intergenic regions. (E, F) Percentage of selected features for given molecular assays with higher percentage in intronic (E) or intergenic (F).

