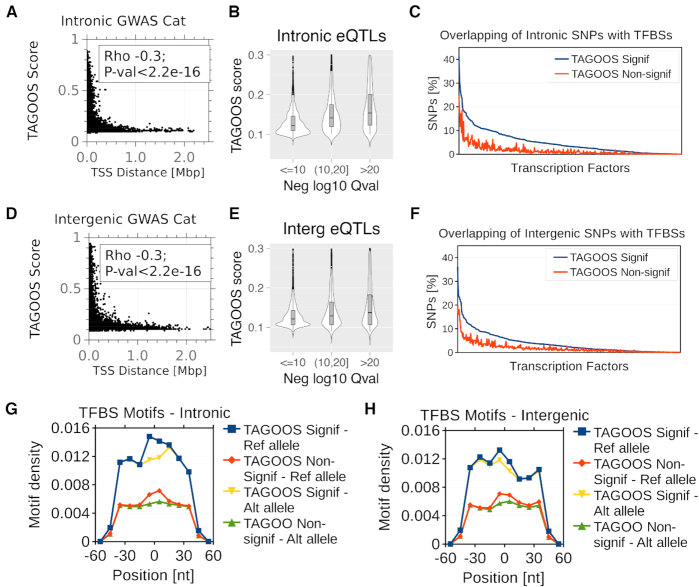
Figure 4.
Functional properties of the TAGOOS scores. (A, D) Scatter plots and Spearman correlation coefficient and P-value of the distance to the nearest transcription start sites (TSS) and the TAGOOS scores for unseen GWAS Catalog SNPs in intronic (A) and intergenic (D) regions. (B, E) Violin plots of TAGOOS scores of unseen GTEX eQTLs split by the negative decimal logarithm of the maximal Q-value association in intronic (b) and intergenic (e) regions. (C, F) Percentage of intronic (C) and intergenic (F) unseen GWAS Catalog SNPs with significant and non-significant TAGOOS scores annotated with each transcriptional regulator from the ReMap database ordered by the decreasing difference between the blue (TAGOOS Signif) and red (TAGOOS non-significant) lines (PWilcoxpaired = 2.2 × 10⁻¹⁶). (G, H) Motif density in 10 nt bins in a 100 nt window around intronic (G) and intergenic (H) unseen GWAS Catalog SNPs split according to the TAGOOS significance and the reference or most common alternative allele.

