Figure 5.
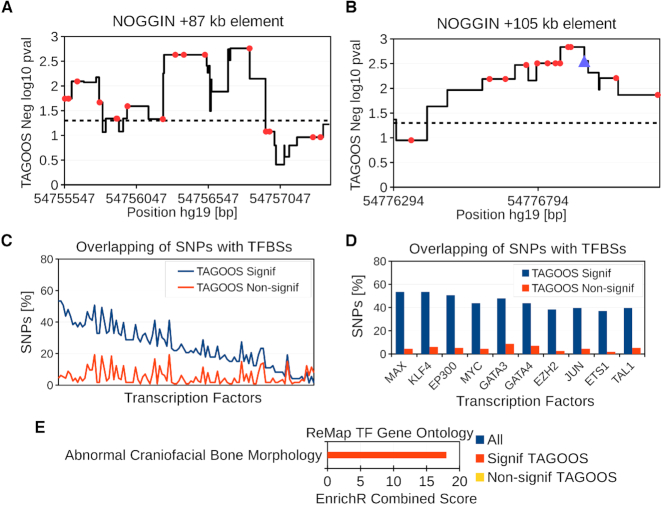
Analysis of the rs227727 linkage disequilibrium (LD) block (hg19, chr17:54,752,926-54,778,620). (A, B) Negative decimal logarithm of the TAGOOS P-value for the +87 kb NOGGIN (chr17:54,754,994-54,757,864) and +105 kb NOGGIN regions (hg19,chr17:54,776,180-54,777,328) with common SNPs (Red points) and the previously validated SNP rs227727 (Blue triangle). The horizontal dashed line stands for the significance threshold. (C) Percentage of SNPs in the rs227727 LD block with significant and non-significant TAGOOS scores annotated with each transcriptional regulator from the ReMap database ordered by the decreasing difference between the blue (TAGOOS Signif) and red (TAGOOS Non-signif) lines (PWilcoxpaired = 2.2 × 10⁻¹⁶). (D) Zoom into the first ten transcription factors of subfigure (C). (E) Mouse craniofacial phenotype annotation enrichment of TFs with highest (Signif TAGOOS) or lowest (Non-signif TAGOOS) binding difference between TAGOOS-significant and non-significant SNPs.

