Figure 6.
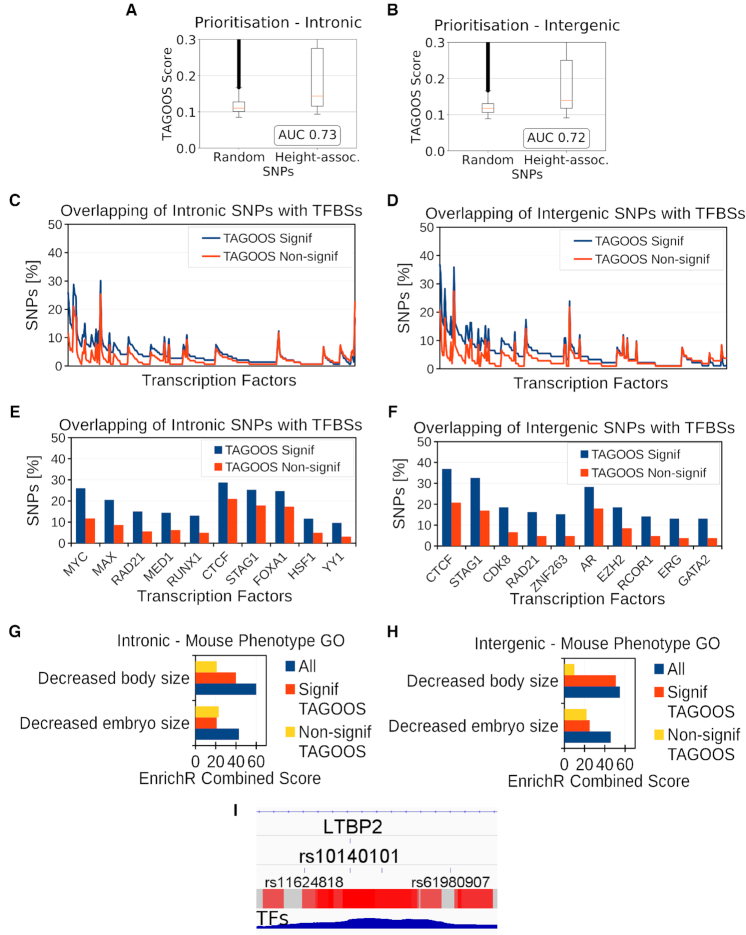
Height GWAS analysis with the TAGOOS scores. (A, B) Box plot and AUC performance of unseen height GWAS SNPs in intronic (A) and intergenic (B) regions. (C, D) Percentage of unseen intronic (C) and intergenic (D) height SNPs with significant and non-significant TAGOOS scores annotated with each transcriptional regulator from the ReMap database ordered by the decreasing difference between the blue (TAGOOS Signif) and red (TAGOOS Non-signif) lines (PWilcoxpaired = 2.2 × 10⁻¹⁶). (E, F) Zoom into the first ten transcription factors of subfigures (C, D). (G, H) Mouse body size phenotype annotation analysis of ReMap TFs with with highest (Signif TAGOOS) or lowest (Non-signif TAGOOS) binding difference between intronic (G) and intergenic (H) TAGOOS-significant and non-significance SNPs. (I) Screenshot of the IGV genome browser showing the TAGOOS score and ReMap TF coverage around the height associated SNP rs10140101. The trackers show the LTBP2 intron, the rs10140101 SNP, surrounding SNPs as reference, and non-redundant ReMap TF coverage.

