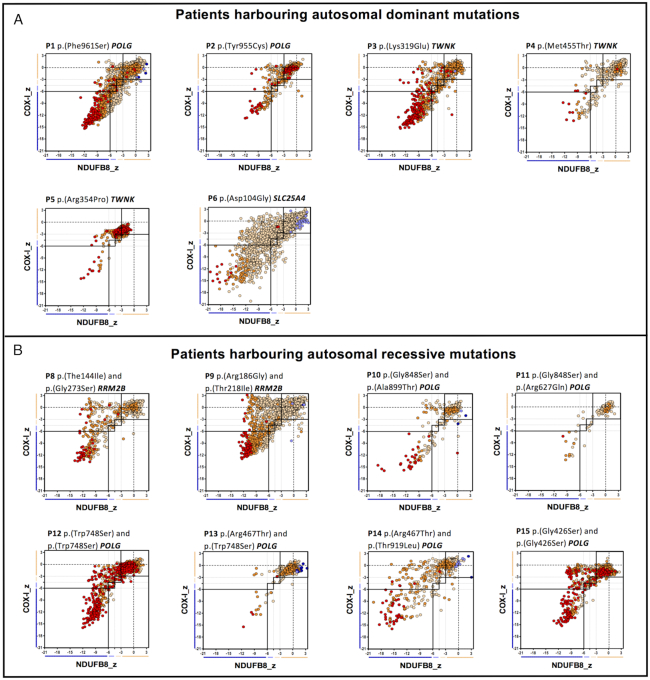
Figure 2.
Mitochondrial respiratory chain (MRC) expression profile for complex I, complex IV and porin levels. Plots show complex I and IV expression profile from patients with (A) autosomal dominant mutations, n = 6 and (B) autosomal-recessive mutations, n = 8. Each dot represents the measurement from an individual muscle fibre, colour coded according to its mitochondrial mass (very low: blue, low: light blue, normal: light orange, high: orange and very high: red). Thin black dashed lines indicate the SD limits for the classification of fibres, lines next to x and y axis indicate the levels of NDUFB8 and COX-I, respectively (beige: normal, light beige: intermediate(+), light blue: intermediate(−) and blue: deficient). Bold dashed lines indicate the mean expression level of normal fibres. Immunofluorescent data used to generate these plots is provided in Supplementary Data file 1.

