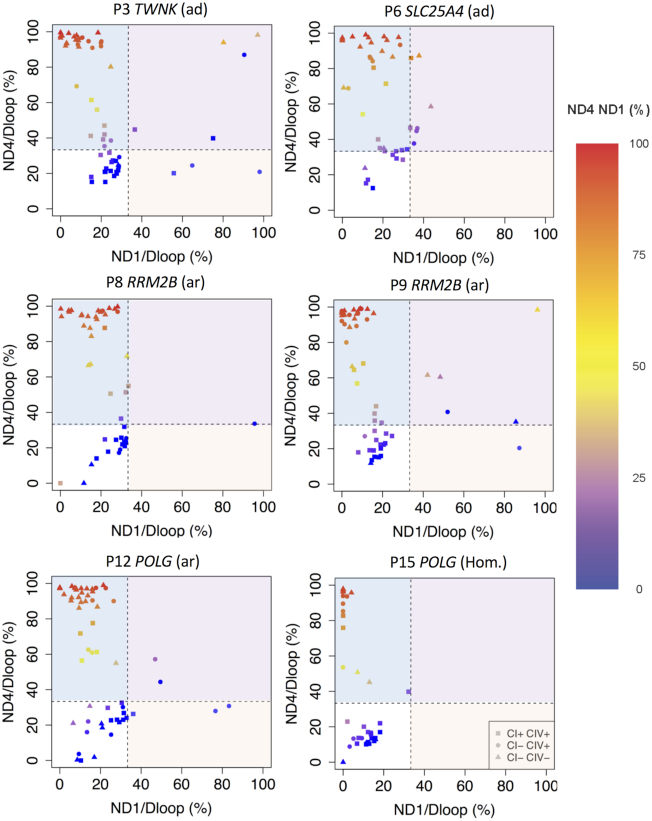
Figure 3.
Triplex real-time PCR results of six patients. Deletions as proportions of two mtDNA targets: MT-ND4/MT-ND1 is the proportion of MT-ND4 per MT-ND1. MT-ND1/D-Loop is the proportion of MT-ND1 relative to the D-Loop. MT-ND4/D-Loop is the proportion of MT-ND4 relative to the D-Loop. Every point represents a single muscle fibre, analysed by real-time PCR. The squares show muscle fibres classed as normal for both complex I and complex IV, circles represent fibres deficient for complex I and normal for complex IV and triangles deficient for both complex I and IV. The dashed line marks where MT-ND4/D-loop and MT-ND1/D-loop percentage deletion equals 33%. Fibres ≤ 33% of MT-ND1/D-Loop or MT-ND4/D-Loop percentage deletion were considered to be without any deletion due to the double/triple-stranded nature of the D-Loop region. Colouring indicates the MT-ND4/MT-ND1 proportion. Areas corresponding to deletions of MT-ND4 are shaded in light blue, deletions of MT-ND1 in light red and both MT-ND1 and MT-ND4 in light purple. Data used to generate these plots is provided in supplementary data file 2.

