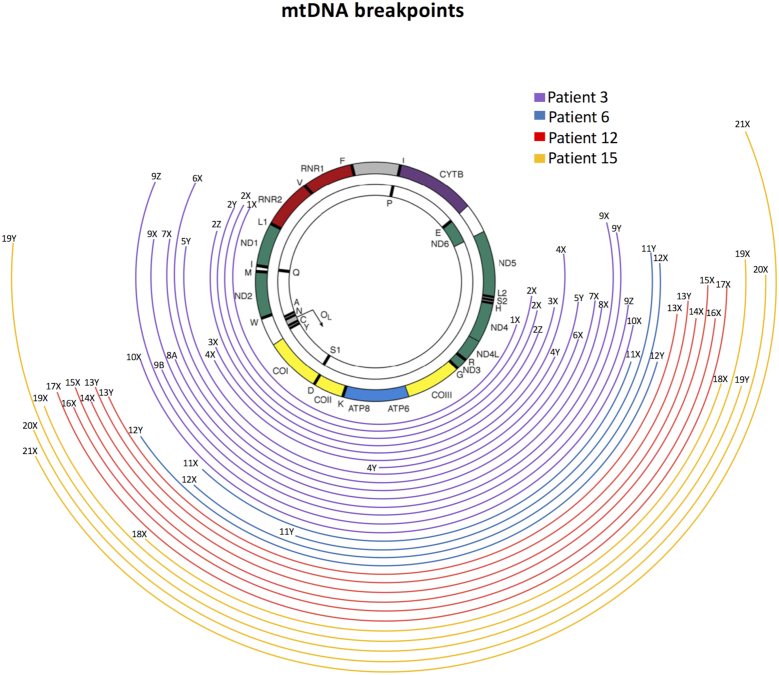
Figure 5.
Mitochondrial DNA deletion spectra from patients 3, 6, 12 and 15. Long range PCR was used to amplify the mitochondrial DNA (mtDNA) from single muscle fibres (n = 21), and then the amplicons sequenced to determine breakpoints. Size and position within the mitochondrial genome of all mtDNA deletions identified by 12 Kb long-range PCR are presented as coloured curved lines. Lines endings on the left and right mark the 5′ and 3’ breakpoints, respectively.

