Figure 1.
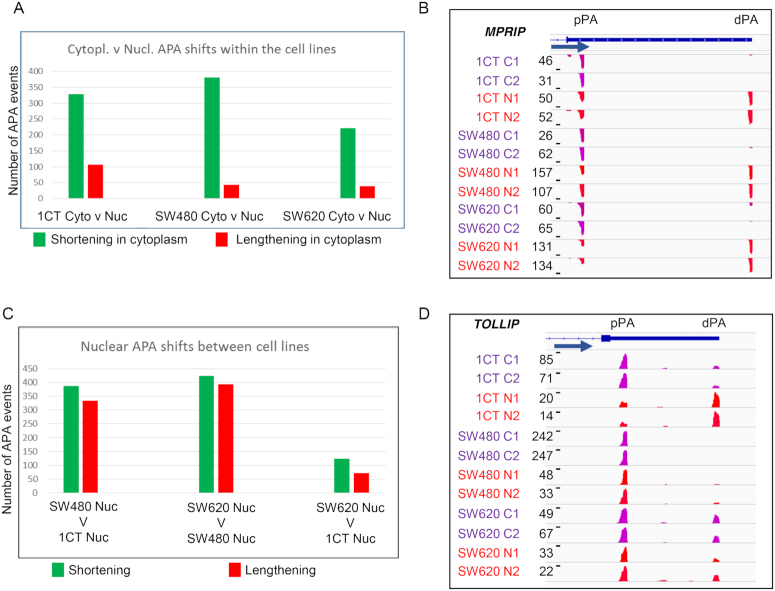
Nuclear and cytoplasmic UTR-APA profile comparison. (A and C) Bar charts displaying the number of events showing significant differential APA isoform representation when comparing UTR-APA isoform abundances. The identity of the samples being compared is shown under each comparison with each bar representing events where the shorter APA isoforms (green) or longer APA isoforms (red) have a significantly higher relative representation in the first sample. Significant differentially represented APA isoforms are those in which P≤0.01 (Fisher's exact test) and the isoform abundance change is ≥5% relative to total APA isoforms associated with that gene. (A) Shows the number of significant UTR-APA shortening (green) and lengthening (red) events occurring when comparing nuclear to cytoplasmic fractions for each of the three different cell lines. (B) Screenshot of MPRIP as an example of a gene that shows an overrepresentation of the proximal APA isoform in the cytoplasmic fraction, relative to the nuclear fraction, in all three colorectal cell lines analysed here. (C) Shows the number of significant UTR-APA shortening and lengthening events occurring when comparing nuclear fractions from each of the three different cell lines. (D) Screenshot of TOLLIP as an example of a gene that shows shortening in the nucleus when comparing 1CT to SW480 or SW620 cells without affecting the cytoplasmic APA profile highlighting the importance of using fractionation to make any predictions on the potential physiological impact of the profile changes observed. B&D), Read numbers in reads per million (RPM) and cell lines are indicated to the left of each track. C1, C2: cytoplasmic fractions repeat 1 and 2. N1 and N2: nuclear fractions repeat 1 and 2. Tracks show reads from sequencing the 3′ends of extracted RNAs. Gene structure, gene names and the position of the proximal (pPA) and distal (dPA) poly(A) sites are indicated above the tracks and blue arrow indicates the orientation of the respective gene. Screenshots were generated using IGV, with ‘window function’ set to ‘Mean’ and Auto scale’.

