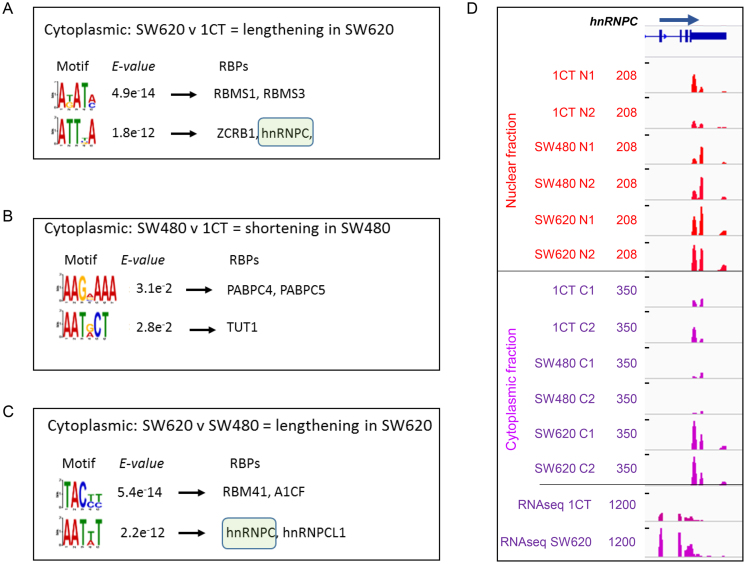
Figure 4.
Motif analysis and interacting RBPs identified in aUTRs extracted from APA isoforms that show differential APA profiles when cytoplasmic APA isoforms are compared between: (A) isoforms that lengthen in SW620 compared to 1CT and (B) that shorten in SW480 compared to 1CT and (C) lengthen in SW620 compared to SW480. In all cases the top 2 significant overrepresented motifs were interrogated using the TOMTOM motif comparison tool to identify the corresponding interacting human RNA binding proteins with the default significance threshold set at E-value <10. The top two RBP hits for each motif are shown. No motifs were found for comparisons of SW620 compared to 1CT cells shortening in former and SW620 compared to SW480 cells shortening in former and SW480 compared to 1CT cells lengthening in former. Green boxes highlight hnRNPC hits. (D) hnRNPC is overexpressed in the nuclear (red) and cytoplasmic (purple) fractions of SW620 compared to SW480 and 1CT cells at the RNA level. Top 12 tracks show reads from sequencing the 3′ ends of extracted nuclear RNAs (tracks 1–6) or cytoplasmic RNAs (tracks 7–12). Bottom two tracks show reads from full RNA-seq of SW620 and 1CT cytoplasmic polyadenylated mRNA. C1, C2: cytoplasmic fractions repeat 1 and 2. N1, N2: nuclear fractions repeat 1 and 2. Read numbers are scaled, tracks 1–6 max = 208 RPM, tracks 7–12 max = 350 RPM, tracks 13–14 max = 1200 RPM.

