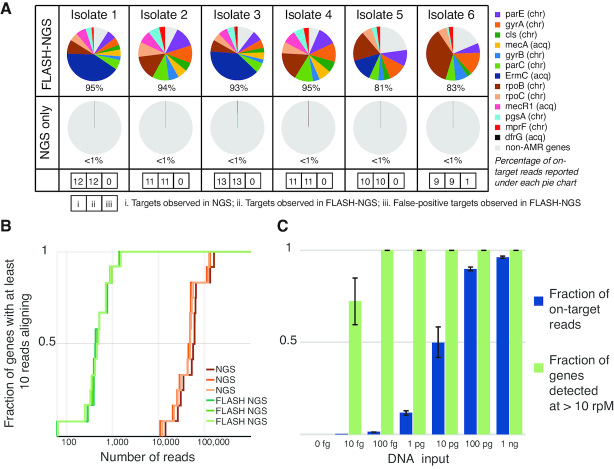
Figure 2.
Results of FLASH on cultured isolates. (A) Proportion of targeted genes detected in FLASH-NGS and NGS libraries of six S. aureus isolates. Average of three replicates. chr: chromosomal gene; acq: acquired gene. Numbers in boxes represent, in order for each isolate: i. number of targets present (based on NGS); ii. number of expected targets observed in FLASH-NGS; iii. number of false-positive targets observed in FLASH-NGS (false positive not depicted in pie chart). (B) For isolate 1 with FLASH, <2000 sequencing reads were needed to achieve coverage of each targeted gene by at least 10 reads. Over 100 000 reads were needed to achieve the same coverage with NGS alone. (C) The fraction of targeted reads relative to background decreases substantially below 100 pg of DNA input; however, with as little as 100 fg input (∼35 copies of the S. aureus genome), the full set of targeted genes was detected at 10 rpM or greater. Bars and error bars represent mean and standard deviation of three replicates.

