
Figure 4.
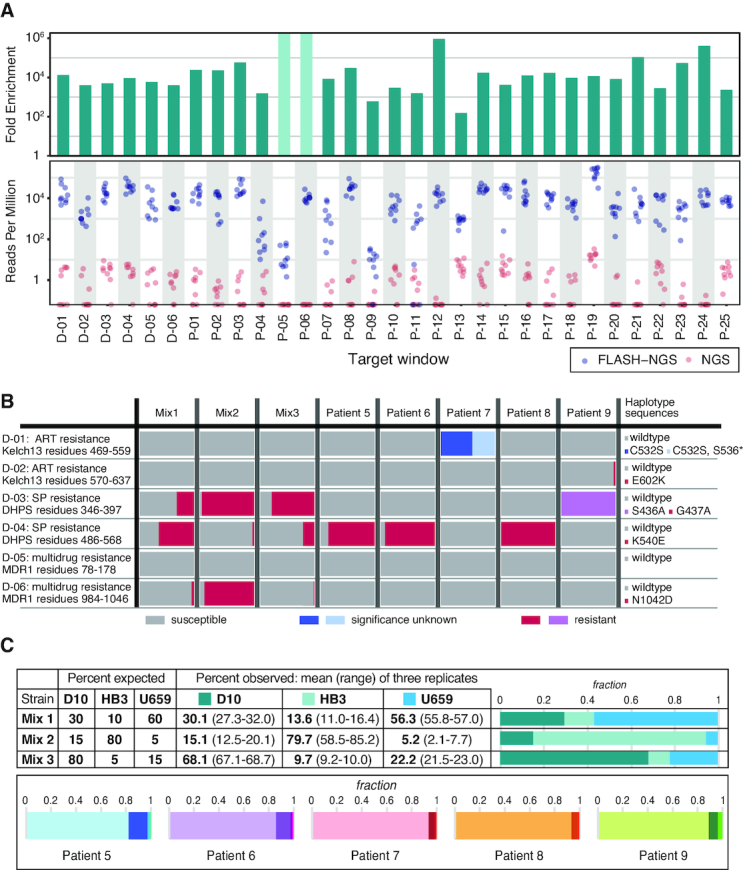
Results of FLASH on dried blood spots. (A) Dried blood spots (DBSs) from malaria lab strains were sequenced using either NGS or FLASH-NGS. Reads per million is plotted for each window for nine FLASH-NGS samples (three strain mixtures, each in triplicate, blue) and nine equivalent NGS samples (pink). Top panel indicates fold enrichment (average FLASH-NGS rpM divided by average NGS rpM). Light green bars in the upper panel represent windows for which no haplotype-determining read pairs were found. (B) Both lab strain mixtures and patient samples were evaluated for the presence of drug resistant haplotypes. Bars indicate mean of three replicates. (C) Target windows with sequences that distinguish the lab strains D10, HB3 and U659 were used to estimate strain ratios in the three mixtures. For the clinical DBS samples, the number of sequencing reads attributable to different haplotypes at each window was determined using SeekDeep. The average proportion of haplotypes at each of the maximum-haplotype containing windows is depicted. Bars indicate mean of three replicates.