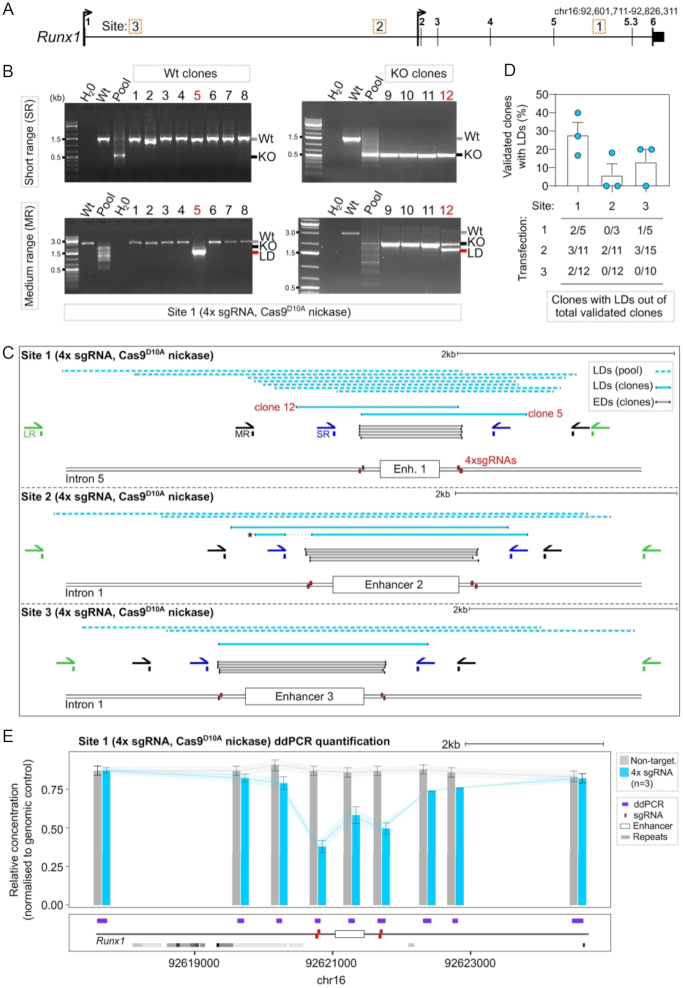
Figure 1.
Characterisation of larger deletions at three sites targeted by CRISPR/Cas9D10A nickase. (A) Locus map of the Runx1 gene showing the positions of evolutionarily conserved cis-regulatory elements (Site 1–3, corresponding to Enhancer 1–3) that were targeted in E14-TG2a-RV mESCs using CRISPR/Cas9D10A nickase. (B) Example gel images from one experiment targeting Site 1. Gel images show PCR amplification from gDNA of isolated wild type (wt) clones (left hand gels) and knock-out (KO) clones (right hand gels) with SR primers (top gels) and MR primers (bottom gels). Wt next to the gel image indicates the size of the wild type allele, KO indicates the size of alleles harbouring the expected deletion, and LD indicates the size of alleles in clones identified as harbouring LDs. (C) Schematic showing the positions of S-R PCR primers (SR, blue), M-R PCR primers (MR, black), L-R PCR primers (LR, green), sgRNAs (red boxes), and LDs isolated from clones (dark blue lines) and pools of cells (light blue dashed lines) at each of the three sites. The allele marked with a star contained a secondary deletion at Site 2 distal to the primary cut site that destroyed a primer binding site. (D) Quantification of clone frequencies with homozygous wild type or knock-out genotypes by S-R PCR (validated clones) that were later found to contain a LD on another allele by M-R PCR. Quantification of clone numbers for each transfection that were homozygous knock-out or wild type and contained a LD on the other allele (n = 3 independent transfections per site, each dot is one independent experiment). (E) ddPCR quantification of deletions across a 7 kb window centred on Enhancer 1. Each bar represents the mean relative concentration of the target DNA sequence (±95% confidence interval). mESCs were targeted with 4× sgRNA (blue bars, n = 3) and a non-targeting control (grey bar).

