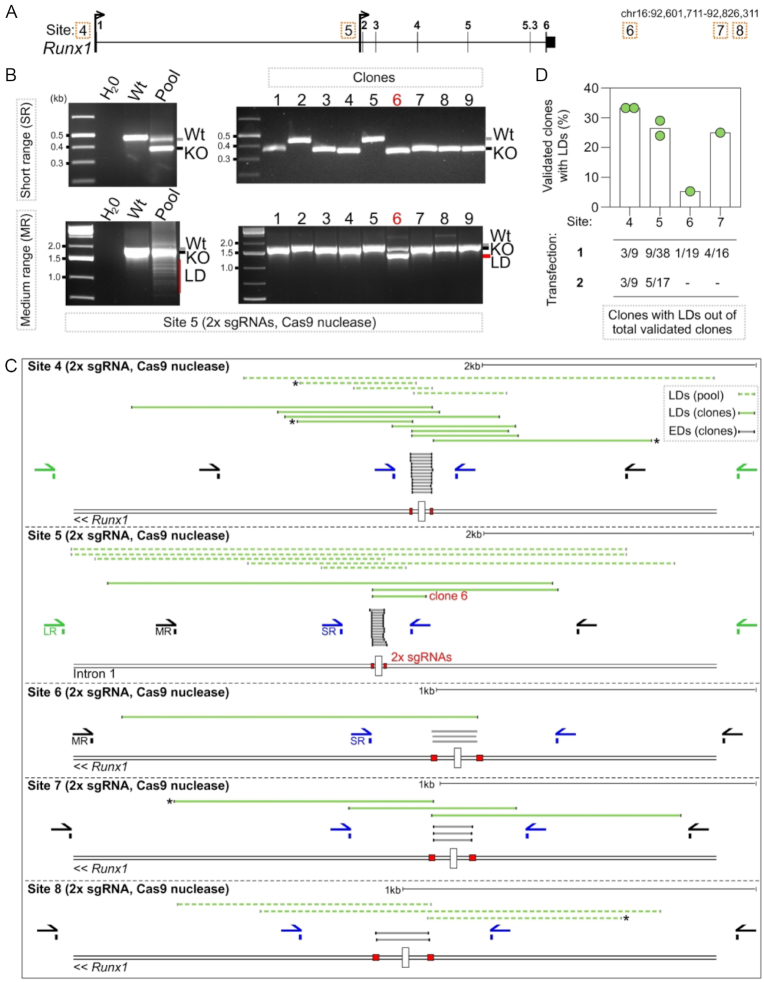
Figure 2.
Frequency of larger deletions when genome editing with Cas9 nuclease. (A) Locus maps of CRISPR/Cas9 nuclease strategies to delete Sites 4–8, corresponding to transcription factor binding sites at the Runx1 locus. (B) Gel images showing PCR amplification of gDNA isolated from a pool of selected cells (left-hand gels) or isolated clones (right-hand gels) targeted with Cas9 nuclease at Site 5. PCR screening was performed with SR primers (top gels) and MR primers (bottom gels). Wt next to the gel image indicates the size of the wild type allele, KO indicates the size of alleles harbouring the expected deletion, and LD indicates the size of alleles identified harbouring larger deletions. (C) Schematic showing the positions of S-R PCR primers (SR blue), M-R PCR primers (MR, black), L-R PCR primers (LR, green), sgRNAs (red boxes), and LDs isolated from clones (dark green lines) and pools of cells (light green dashed lines). (D) Quantification of clone frequencies with homozygous wild type or knock-out genotypes by S-R PCR (validated clones) that contained a LD on one allele only detected by medium-range or longer-range PCR (n = 1–2 independent transfections per site, each dot is one independent experiment).

