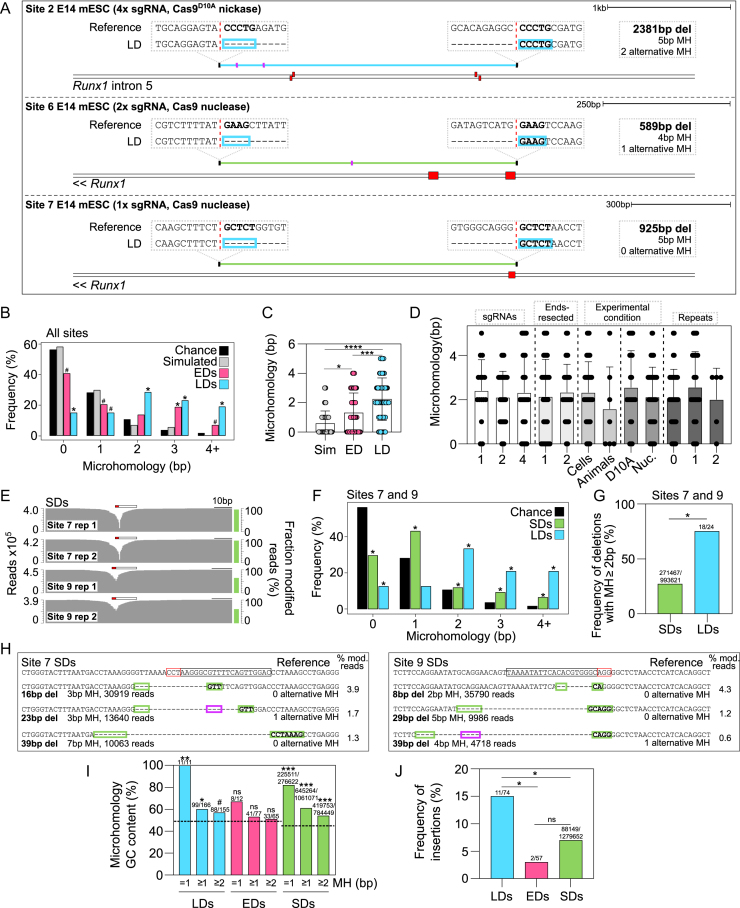
Figure 5.
Microhomologies consistent with MMEJ are prevalent at Cas9-induced larger deletions. (A) Examples of LDs (blue and green lines) with microhomologies and corresponding reference sequences shown (mm9). Sequences outlined with blue boxes represent microhomologies. Red dashed vertical lines represent the exact breakpoint junctions in the repaired alleles and sgRNAs are shown (red boxes). Total deletion size, microhomology amount, and number of alternative (more proximal) microhomologies are shown (pink lines in deleted sequence). (B) Frequency distribution histogram of microhomologies at 74 LD breakpoint junctions (LDs) across 16 sites, 59 EDs across 16 sites (EDs), 74 simulated deletions (Simulated), and the chance expectation of finding at two locations a k-mer of a given length (Chance) (χ2 test, *, P< 6−7, #, P< 0.02). (C) Microhomology at 74 LDs compared to 59 EDs, and 74 simulated deletions (Sim) (two-tailed Kruskal–Wallis test, ****, P<0.0001, ***, P = 0.0007, *, P = 0.0105). (D) Comparison of microhomology at LDs generated with one, two or four sgRNAs, with ends resected in one or two directions, generated under different experimental conditions, or intersecting with 0, 1 or 2 repeat elements (two-tailed Kruskal–Wallis test, P> 0.9999). (E) Short-amplicon sequencing from pools of mESCs targeted using one sgRNA. Fraction of modified reads and read counts are shown. Protospacer (black outlined bar) and PAM (red outlined bar) are indicated. (F) Microhomology quantification in 24 LDs and all SDs mapped at Sites 7 and 9 compared to the chance expectation of finding a k-mer of a given length (χ2 test, *, P< 0.0003). (G) Quantification of deletions containing microhomology ≥2 bp in all SDs and LDs generated at Sites 7 and 9 using one sgRNA (χ2 test, *, P = 5.4−7). (H) Reference sequence and Cas9-induced deletion alleles containing significant microhomologies at their breakpoints. The total number of reads and the percentage of modified reads is shown. Protospacer (black outlined bar) and PAM (red outlined bar) are indicated. Short microhomologies that abut the deletion (green boxes) and alternative microhomologies located within the deleted region (pink boxes) are shown. (I) Quantification of microhomology GC base pair content in microhomologies of different lengths at all LDs, EDs, and SDs at Site 7 and 9. The expected background GC base pair content is shown as a black dashed line. (χ2 test, ns, P> 0.2, #, P = 0.059, *, P< 0.01, **, P< 0.001, ***, P< 10−10). (J) The number of total LDs, total EDs and SDs at Sites 7 and 9 containing a short insertion (χ2 test, *, P< 0.003, ns, P = 0.2395).

