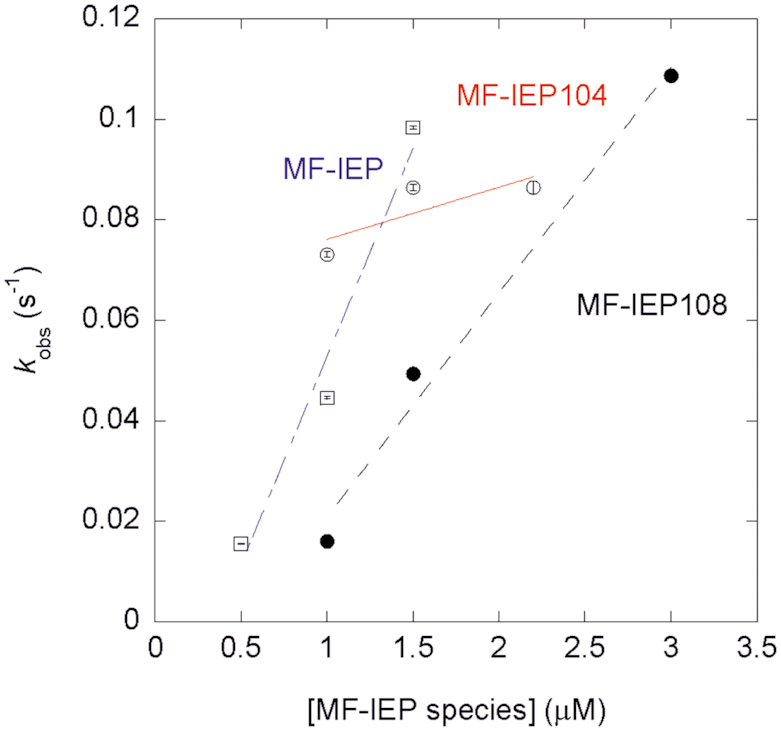
Figure 4.

Pseudo-first order plots from biolayer interferometry for wild-type MF-IEP (blank squares and dot-and-dashed blue line), MF-IEP104 (blank circles and continuous red line) and MF-IEP108 (filled circles and dashed black line). The errors in kobs for each experimental MF-IEP species concentration are from fitting errors of the sensorgrams to a double exponential curve.
