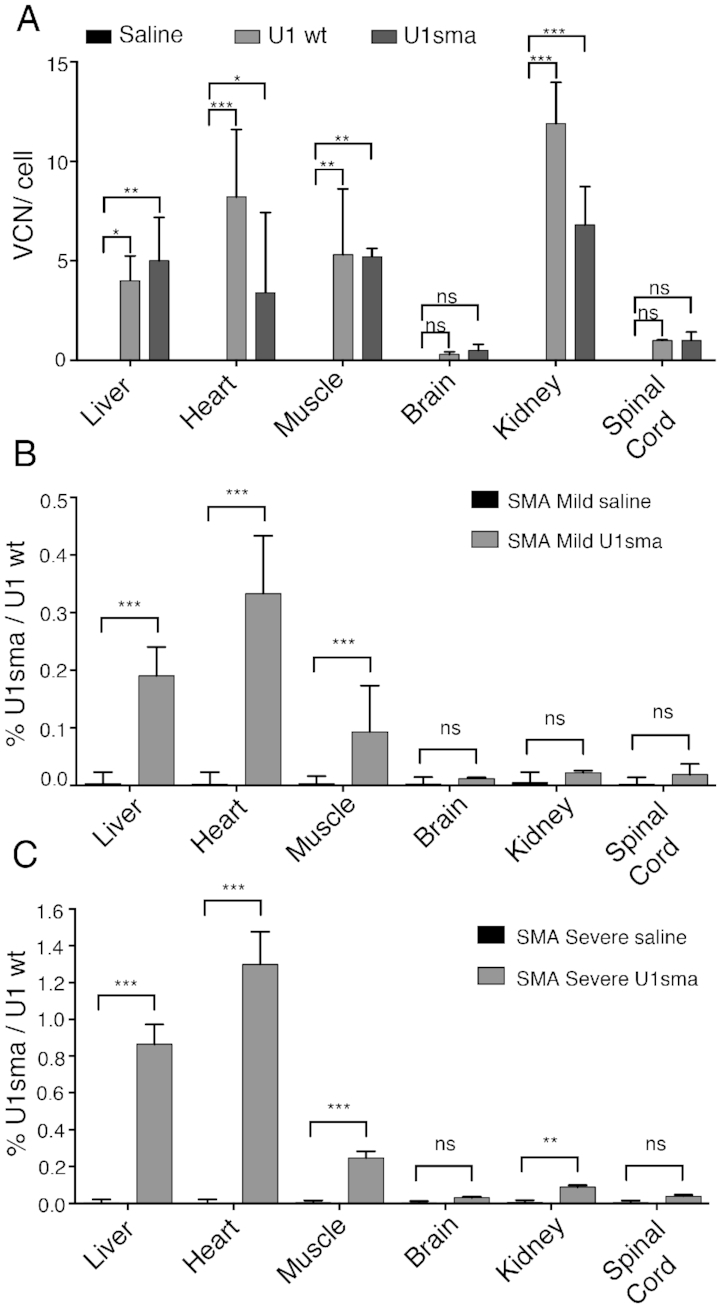
Figure 2.

Tissue distribution of AAV9 DNA and ExspeU1sma RNA expression. (A) SMA mild mice (smn−/−; SMN22TG/2TG) were treated with AAV9-ExspeU1sma (n = 3), AAV9-U1wt (n = 3) and saline (n = 2) with two intraperitoneal injections (P0 and P2) at 1.5 × 10¹² vgp/mouse/injection. Animals were sacrificed and organs collected at P7. Data are expressed as mean ± SD of VCN per cell. Statistical analysis was performed using Two-Way ANOVA. Level of ExspeU1sma expression in (B) SMA mild (smn−/−; SMN22TG/2TG) and (C) SMA severe (smn−/−; SMN22TG/0) mice treated with saline and with AAV9-ExSpeU1sma (two intraperitoneal injections at P0 and P2, 1.5 × 10¹² vgp/mouse/injection). Data (mean ± SD) are expressed as percentage of ExSpeU1sma relative to endogenous U1. For each tissue statistical analysis, performed using Student’s t-test compares saline to U1sma-treated mice at P7 (n = 3 per genotype) (***P < 0.001; **P < 0.01; *P < 0.05; ns, not significant).
