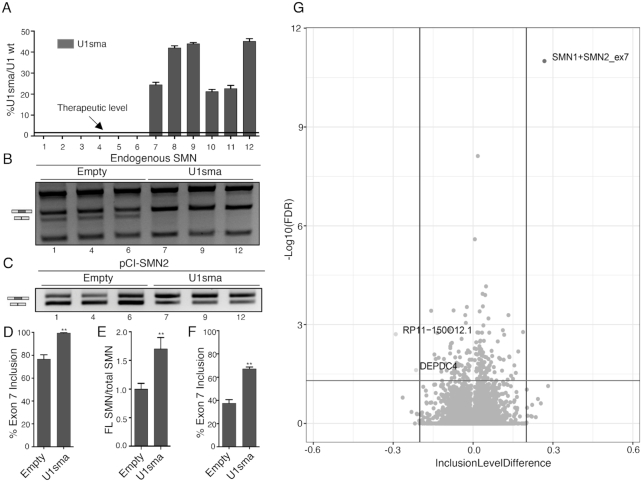
Figure 9.
Effects of ExspeU1sma on the human transcriptome. (A) ExspeU1sma expression level in HEK 293 Flp-In T-REx stable control cells (lanes 1–6) and stable clone cell line expressing ExspeU1sma (lanes 7–12). The threshold therapeutic level of ExspeU1sma is indicated. Data are expressed as mean ± SD. (B) ExspeU1sma rescues endogenous SMN exon 7 inclusion. The indicated clones were analyzed by RT-PCR and amplified fragments digested with DdeI restriction enzyme to obtain SMN1 and SMN2 exon 7 inclusion (FL) and exclusion (Δ7) fragments, respectively. The SMN2 exon 7 inclusion and exclusion bands are indicated. (C) Transfection experiment of pCI-SMN2 minigene in HEK 293 Flp-In T-REx empty and stable clones. The SMN2 exon 7 inclusion and exclusion bands are indicated. (D) Quantification of the percentage of SMN2 exon 7 inclusion of endogenous SMN shown in panel B. (E) qPCR of endogenous full length (FL) SMN transcripts to total SMN transcripts in three representative ExspeU1sma stable clones. Expression level of control clones is set to 1. (F) Quantification of percentage of SMN2 exon 7 inclusion of pCI-SMN2 minigene transfection experiment shown in panel C. (G) Volcano plot showing changes in SE alternative splicing category between empty clones (n = 6) and ExspeU1sma stable clones (n = 6). Horizontal and vertical lines indicate cut-off values. Dots represent SMN1 + SMN2 exon 7 (ID = 93529), RP11-150O12.1 (ID = 106222) and DEPDC4 (ID = 130674) splicing events (FDR < 0.05; Inclusion Level Difference ≤−0.2 or ≥ 0.2). Significantly affected genes are indicated. In panel (D), (E) and (F) data are expressed as mean ± SD and statistical analysis was performed using Student’s t-test (**P < 0.01).

