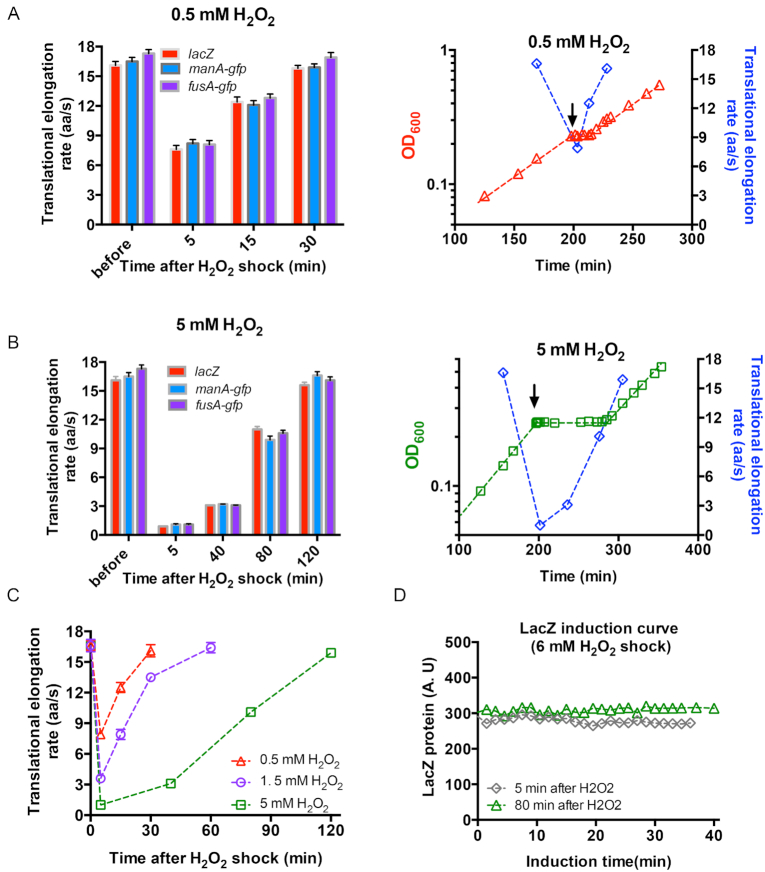
Figure 3.
The translational elongation rate of E. coli subjecting to 0.5, 5 and 6 mM H2O2 treatment. (A) The translational elongation rate of three genes of E. coli cells before treatment as well as at various time points (5, 15, 30 min) after the addition of 0.5 mM H2O2. At the right panel, the translational elongation rate is shown together with the growth curve of E. coli cells subjecting to 0.5 mM H2O2 treatment. The data of translational elongation rate is the average of the values of three genes. (B) The translational elongation rate of three genes of E. coli cells before H2O2 treatment as well as at various time points (5, 40, 80 and 120 min) after the addition of 5 mM H2O2. At the right panel, the translational elongation rate is shown together with the growth curve of E. coli cells subjecting to 5 mM H2O2 treatment. The data of translational elongation rate is the average of the values of three genes. (C) The translational elongation rate of E. coli at various times points after the addition of 0.5, 1.5 and 5 mM H2O2. The data at time 0 corresponds to the normal value before H2O2 addition. (D) The induction curve of LacZ protein for E. coli cells growing in glucose minimal medium at two time points (5 min and 80 min) after the addition of 6 mM H2O2.

