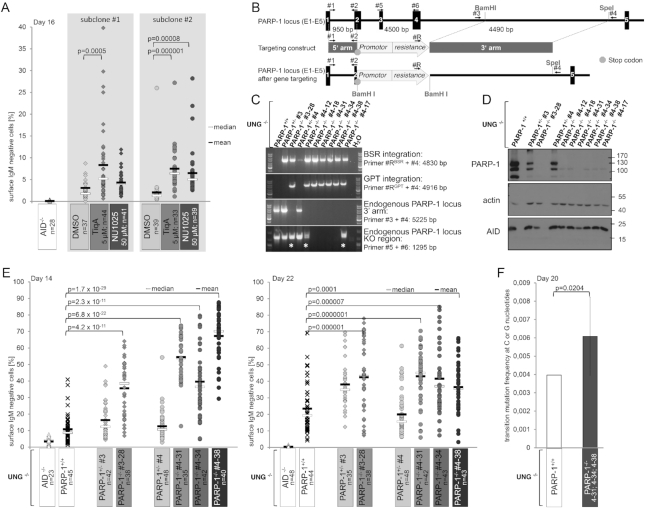
Figure 3.
PARP-1 activity inhibits AID activity at the Ig locus. (A) Effects of PARP inhibition on AID activity in DT40UNG−/− cells. Each dot indicates %sIgM loss in one single cell clone (see Supplementary Figure S2A for experimental system). Data represent three independent experiments. Statistically significant differences are marked with brackets, and P-values are derived from a two-sided Student's t-test. (B) Strategy for inactivation of PARP-1 in DT40UNG−/− cells. Exons are marked as boxes, primers used for constructing the knockout vector and for genotyping of targeted clones are indicated. (C) Detection of WT and targeted alleles in parental, heterozygous and homozygous cells by the PCR approaches depicted in B). Asterisks mark clones in which one arm of the targeting vector did not integrate by homologous recombination. (D) Western Blot analysis for PARP-1 protein expression in the clones analyzed in (C). (E) Analysis of AID activity in DT40UNG−/−PARP-1−/− and the respective parental and heterozygous cells. Data are representative of more than two independent experiments, statistical significance was determined using the two-sided Student's t-test. (F) Sequence analysis of the λ light chain locus in DT40UNG−/−cells and in three clones of DT40UNG−/−PARP-1−/− cells shown in (F). Significance analysis: two-sided Fisher's exact test. Error bars show the standard deviation.

