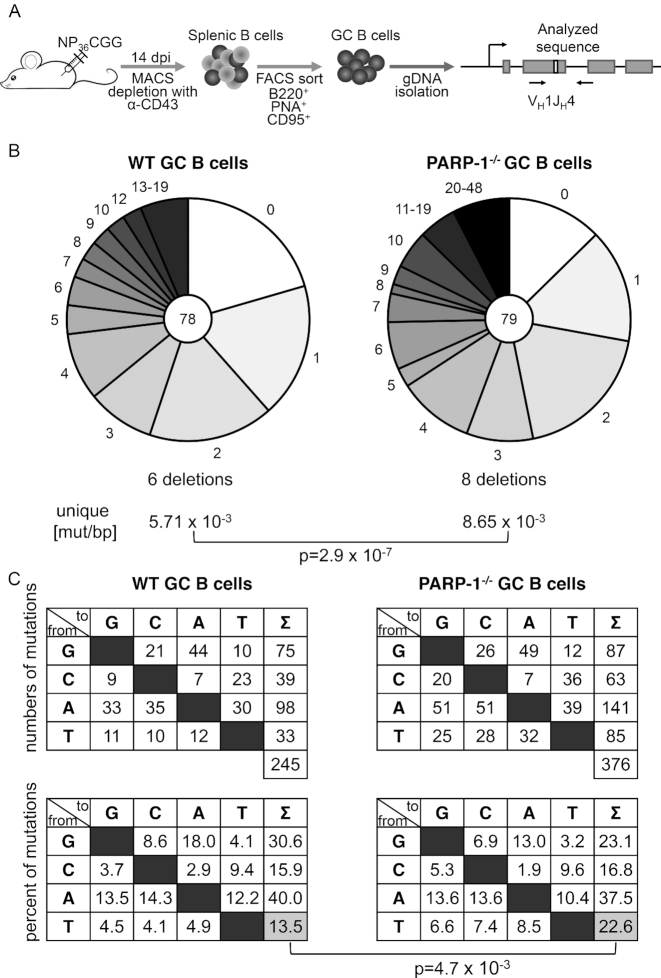
Figure 5.
PARP-1 restricts somatic hypermutation in vivo. (A) Experimental setup to analyze somatic hypermutation in germinal center (GC) B cells of mice. (B) Sequence analysis of SHM in the JH4 intron in three pairs of WT and PARP-1−/− mice. Numbers in the pie charts indicate numbers of analyzed sequences; relative amounts of sequences with the indicated number of mutations are given. Mutation frequencies are compared by a two-sided Fisher's exact test. (C) Mutation pattern (top: absolute, bottom: relative) of unique mutations in WT and PARP-1−/− mice for the analysis shown in (B). Significance analysis: two-sided Fisher's exact test.

