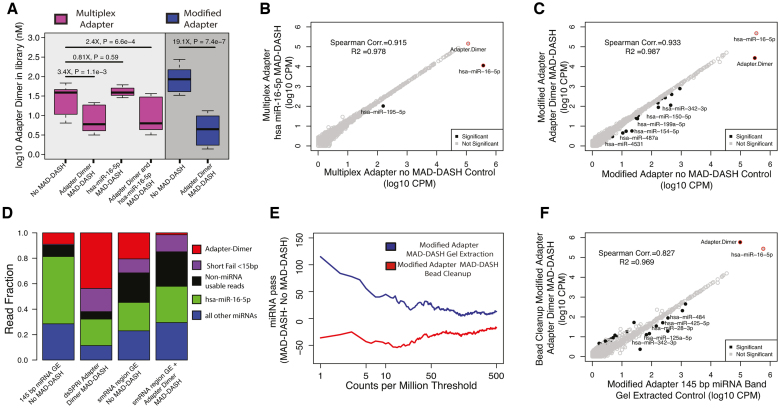
Figure 4.
MAD-DASH smRNA-seq reduces adapter dimer and hsa-miR-16–5p in human plasma samples. (A) Adapter dimer concentrations in control or treated MAD-DASH smRNA-seq replicates (n = 3 in each group) made using the multiplex 5′ adapter (magenta) or the modified 5′ adapter (blue) were determined using qPCR and a synthetic adapter dimer library standard. Multiplex adapter sample concentration were adjusted 4× to account for the three other equimolar multiplex adapters. (B andC) Sequencing read counts from gel extracted, normalized replicate groups are plotted for treated vs control MAD-DASH samples using either (B) multiplex adapters and targeting hsa-miR-16–5p, or using (C) modified adapter and targeting adapter dimer. hsa-miR-16–5p depletion would not expected to vary between multiplex versus modified adapter use due to an identical sgRNA/PAM location. Adapter dimer depletion depicted in (C) represents a depletion of residual adapter dimer remaining after gel extraction, indicating that modified adapter dimer MAD-DASH can yield significant library improvements even when using traditional library cleanup methods. As in previous figures, significantly different sequences are filled black circles, with those having a log2-fold-change > 1 being labeled with text. Non-significantly different miRNAs are depicted as open gray circles. Adapter dimer and hsa-miR-16–5p are depicted as red circles with the same grey or black fill to denote significance. Significance was determined with DESeq2 and set as a Benjamini–Hochberg corrected P-value < 0.05. (D) Averaged read fraction of downsampled and CPM normalized adapter dimer sequences, hsa-miR-16–5p, non-hsa-miR-16–5p miRNAs and non-miRNA usable reads (see ‘Materials and Methods’ section) in modified adapter control miRNA band gel extracted (abbreviated as GE) samples, bead cleanup adapter dimer MAD-DASH samples and control and adapter dimer MAD-DASH smRNA region GE samples (E) Plot depicting the difference in the number of mature miRNA species reaching a specified count per million threshold between gel extracted or bead cleanup MAD-DASH plasma samples targeting adapter dimer. Downsampling and CPM normalization was performed as described in ‘Materials and Methods’ section. (F) Sequencing read counts from normalized replicate groups are plotted for bead cleanup adapter dimer MAD-DASH versus miRNA band gel control extracted samples. Significantly different sequences are filled black circles, with those having a log2-fold-change > 1 and a base mean of 100 being labeled with text to prevent overlapping labels of more lowly abundant significant sequences. Non-significantly different miRNAs are depicted as open gray circles. Adapter dimer and hsa-miR-16–5p are depicted as red circles with the same gray or black fill to denote significance. Significance was determined with DESeq2 and set as a Benjamini–Hochberg corrected P-value < 0.05.

