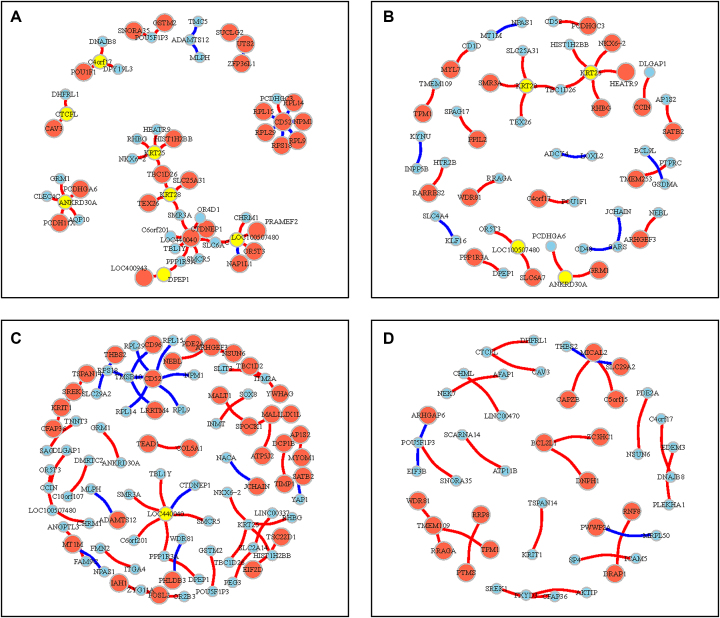
Figure 6.
Cell line-specific regulostats of lung cancer cells. (A) Regulostat specific to an SBC-3 lung cancer cell line that is sensitive to drug FK866 (bin 1). (B) Regulostat specific to NCI-H1876 lung cancer cell line that is sensitive to drug FK866 (bin 1). (C) Regulostat specific to SW1573 lung cancer cell line that is resistant to drug FK866 (bin 4). (D) Regulostat specific to SK-LU-1 lung cancer cell line that is resistant to drug FK866 (bin 4). The node size shows the gene expression level for that specific cell line, and its color is red if that gene has the highest expression value in the correlation line of PLC or blue vice versa (see Figure 2B). Yellow nodes indicate the gene has both the highest and lowest expression when combined with different genes in a given number of pairs. Red edges: positive PLCs; blue edges: negative PLCs.

