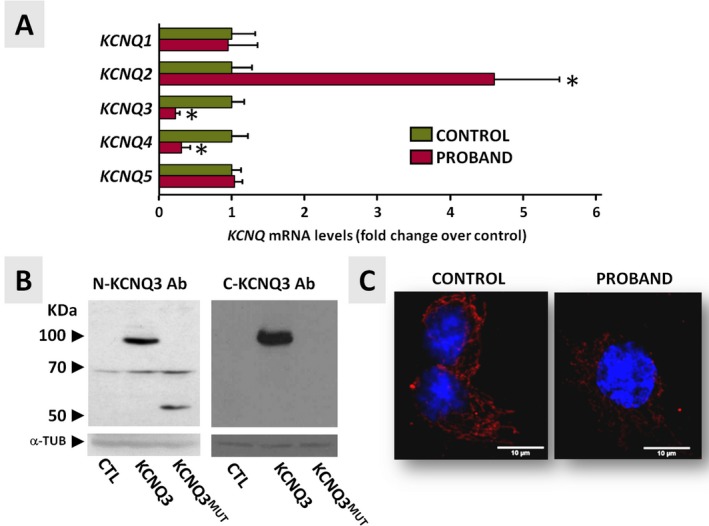
Figure 2.

KCNQ transcript and protein expression profile in primary fibroblasts from the proband (individual II‐3) and healthy brother (individual II‐1). A, KCNQ1‐5 qRT‐PCR data from primary fibroblasts. Data are expressed as cycle threshold values for each KCNQ transcript normalized to that of UBC; after normalization, data from control fibroblasts were expressed as one (green bars), and data from proband fibroblasts were expressed relative to controls (red bars). Asterisks indicate values statistically different (P < 0.05) from respective controls. B, Western blot performed on protein lysates from transiently transfected CHO cells using N‐ and C‐KCNQ3 antibodies. CHO cells were transfected with wild‐type (KCNQ3) or mutant (KCNQ3MUT) KCNQ3 cDNA, and total lysates were analyzed with N‐KCNQ3 (left panel) or C‐KCNQ3 (right panel) antibodies. α‐tubulin (α‐TUB) served as a loading control. C, Confocal images of fibroblasts from the proband (individual II‐1) and the healthy brother (individual II‐1) stained with N‐KCNQ3 primary antibodies (in red) and a nuclear marker (Hoechst, in blue)
