Figure 3.

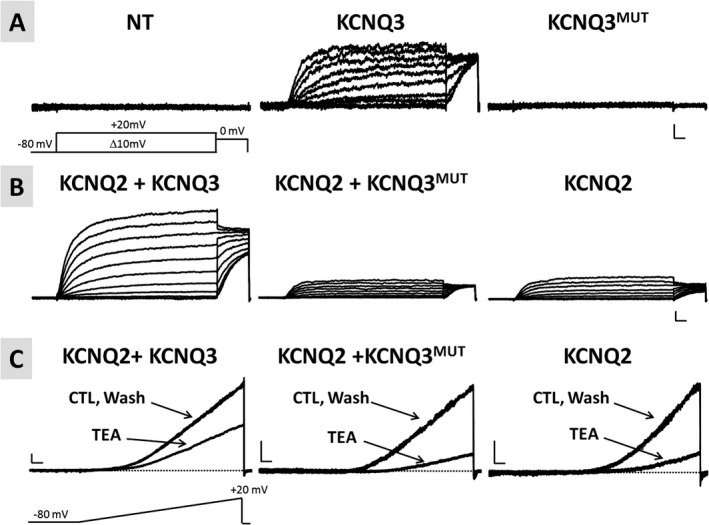
Functional characterization of homomeric or heteromeric channels incorporating KCNQ3 p.(Phe534Ilefs*15) subunits. A, Representative current traces from nontransfected cells (NT; left panel) or from cells transfected with either wild‐type KCNQ3‐ (KCNQ3; middle panel) or KCNQ3 p.(Phe534Ilefs*15)‐encoding plasmids (KCNQ3MUT; right panel) in response to the voltage protocol shown. Horizontal scale bar: 100 ms; vertical scale bar: 2 pA/pF. B, Representative current traces recorded in cells expressing the indicated subunits, in response to the same voltage protocol shown in A. Horizontal scale bar: 100 ms; vertical scale bar: 20 pA/pF. C, Representative current traces from cells expressing the indicated subunits in response to the indicated voltage ramp protocol before TEA exposure (CTL, control), during TEA exposure (TEA, 3 mmol/L), and upon drug washout (Wash). Horizontal scale bar: 200 ms; vertical scale bar: 10 pA/pF
