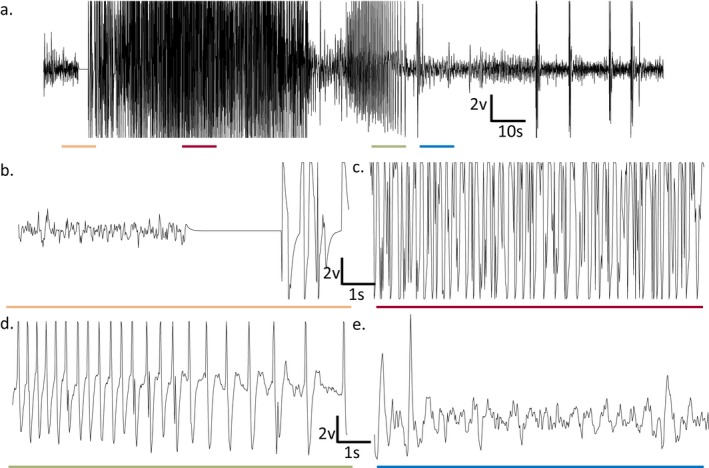
Figure 1.

Representative EEG trace prior to and following amygdala stimulation in a lamotrigine‐resistant fully kindled rat. (A) Full EEG trace (180 s) with 10‐s portions underlined for (B‐E). The primary afterdischarge portion is indicated. (B) 10‐s period corresponding to the orange line in (A); baseline recording period with stimulation artifact (3 s). (C) 10‐s period corresponding to the red line in (A); post‐stimulation EEG activity coincident with behavioral seizure activity (racine 4–5 seizures, not shown). (D) 10‐s period corresponding to the green line in (A); reduction in afterdischarge burst frequency corresponding to cessation of behavioral seizure activity (not shown). (E) 10‐s period corresponding to the blue line in (A); approximate return to baseline EEG activity (eg, a minimum of 3 s between bouts of high‐amplitude and high‐frequency activity). Sampling occurred at 50 Hz. The sample trace was obtained from an animal treated with rufinamide (40 mg/kg) and was not protected (ie, generalized behavioral seizure activity was observed)
