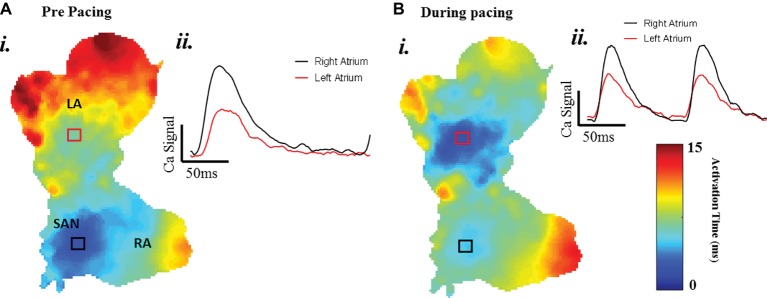
Figure 3.
The change of atrial conduction in optogenetic mice during after blue light stimulation. Maps produced by mapping the midpoint time of the CaT rise. (A) Ca2+ transient activation map during intrinsic pacing, before optical pacing. (B) Ca2+ transient activation map during optical pacing with blue (470 nm) light pulses.

