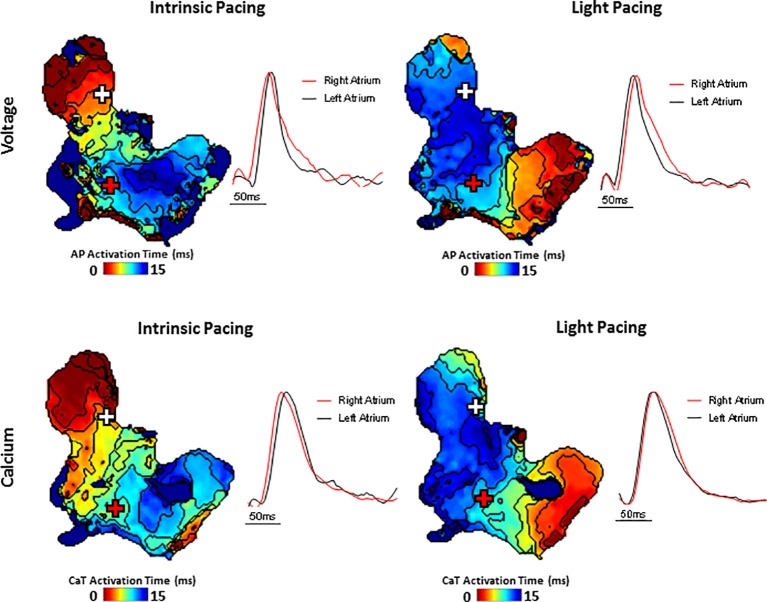
Figure 4.
Simultaneous voltage (top panels) and Ca2+ transient (bottom panels) activation maps reconstructed from spontaneous sinus rhythmic (left panels) and light paced (right panels) SAP. Maps were produced by mapping the midpoint time of the voltage and CaT rise with examples of voltage and Ca2+ transient traces from indicated regions of the preparation (white and red cross).

