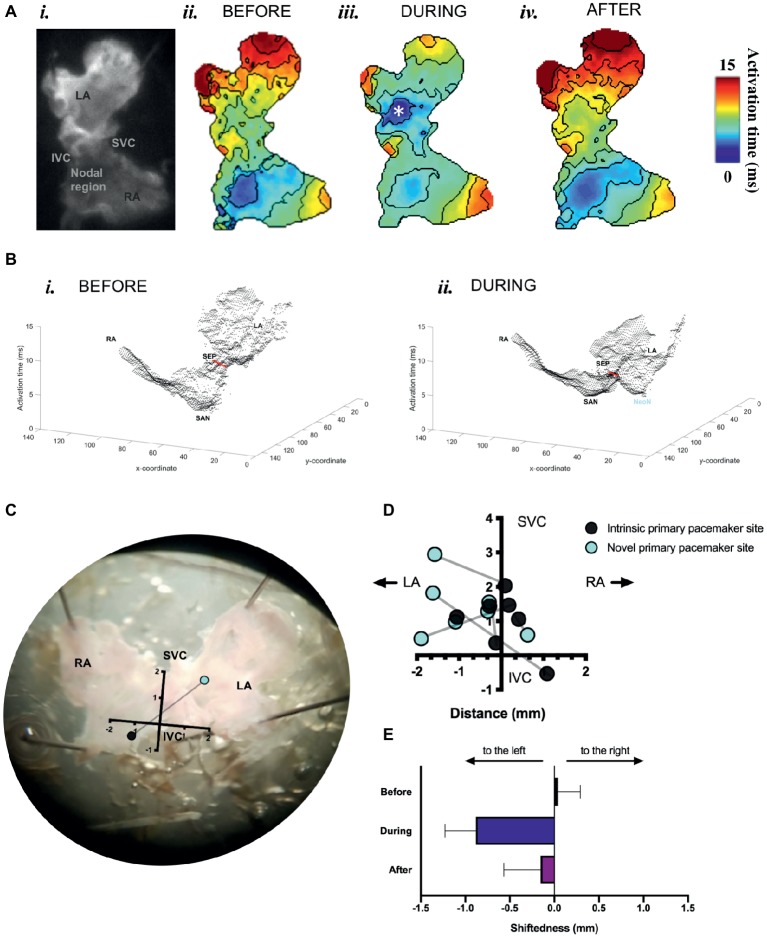
Figure 5.
Mapping of activation in SAPs under sinus rhythm and under optogenetic pacing. (A) (i) Representative SAP—camera view. (ii) Activation map for this SAP before optogenetic pacing. (iii) Activation map during pacing (note formation of “neonode”, white asterisk). (iv) Activation map after pacing. Activation maps are calculated from Ca2+ transients. Fifty pacing spikes given, at 6.67 Hz. Contours drawn at 1/frame rate of the EMCCD. Scale bar, right. (B) 3-D graphical rendering of activation maps (i) before pacing, (ii) during pacing. SVC-IVC axis in red. Activation time on z-axis. (C) Representative SAP—microscope view. Pacemaker shift overlaid. SVC-IVC axis shown. Distances in mm. (D) SVC-IVC axis with relative pacemaker shifts plotted (n = 7). (E) Mean change in “shiftedness.” LA, left atrium; RA, right atrium; SAN, sinoatrial node; SVC, superior vena cava; IVC, inferior vena cava; SEP, septum; NeoN, neonode.

