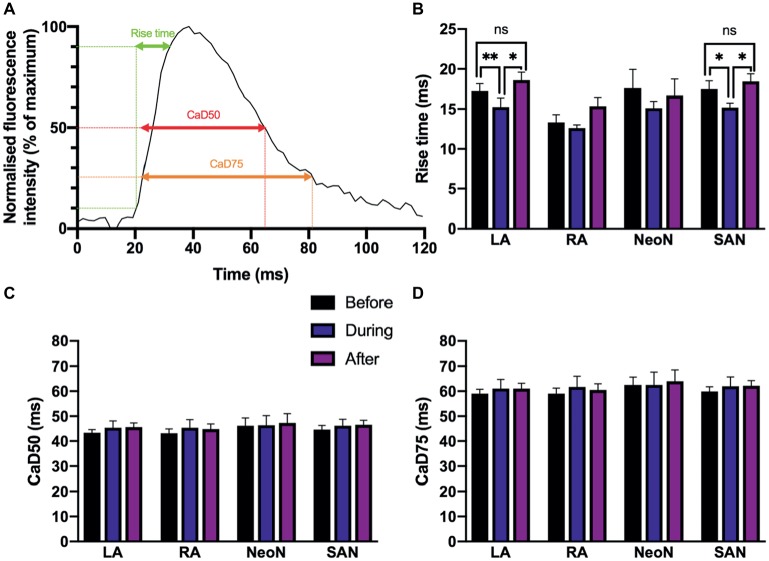
Figure 7.
(A) Characteristics of Ca2+ transients recorded from different regions under sinus rhythm and optogenetic pacing. Representative Ca2+ transient illustrating rise time; CaD50 (Ca2+ transient duration to 50% of the decay); and CaD75 (Ca2+ transient duration to 75% of the decay). CaD50 and CaD75 are calculated from max. dF/dt (max. upstroke) as detailed in the protocol. (B) Mean rise time, before (n = 7), during (n = 7), and after (n = 6) optogenetic pacing. Key at center. Grouping is by region: LA, left atrium; RA, right atrium; NeoN, neonodal region (n = 4); SAN, nodal region. (C) Mean CaD50 values, no overall significant effect of optogenetic pacing. (D) Mean CaD75 values, no overall significant effect of optogenetic pacing.

