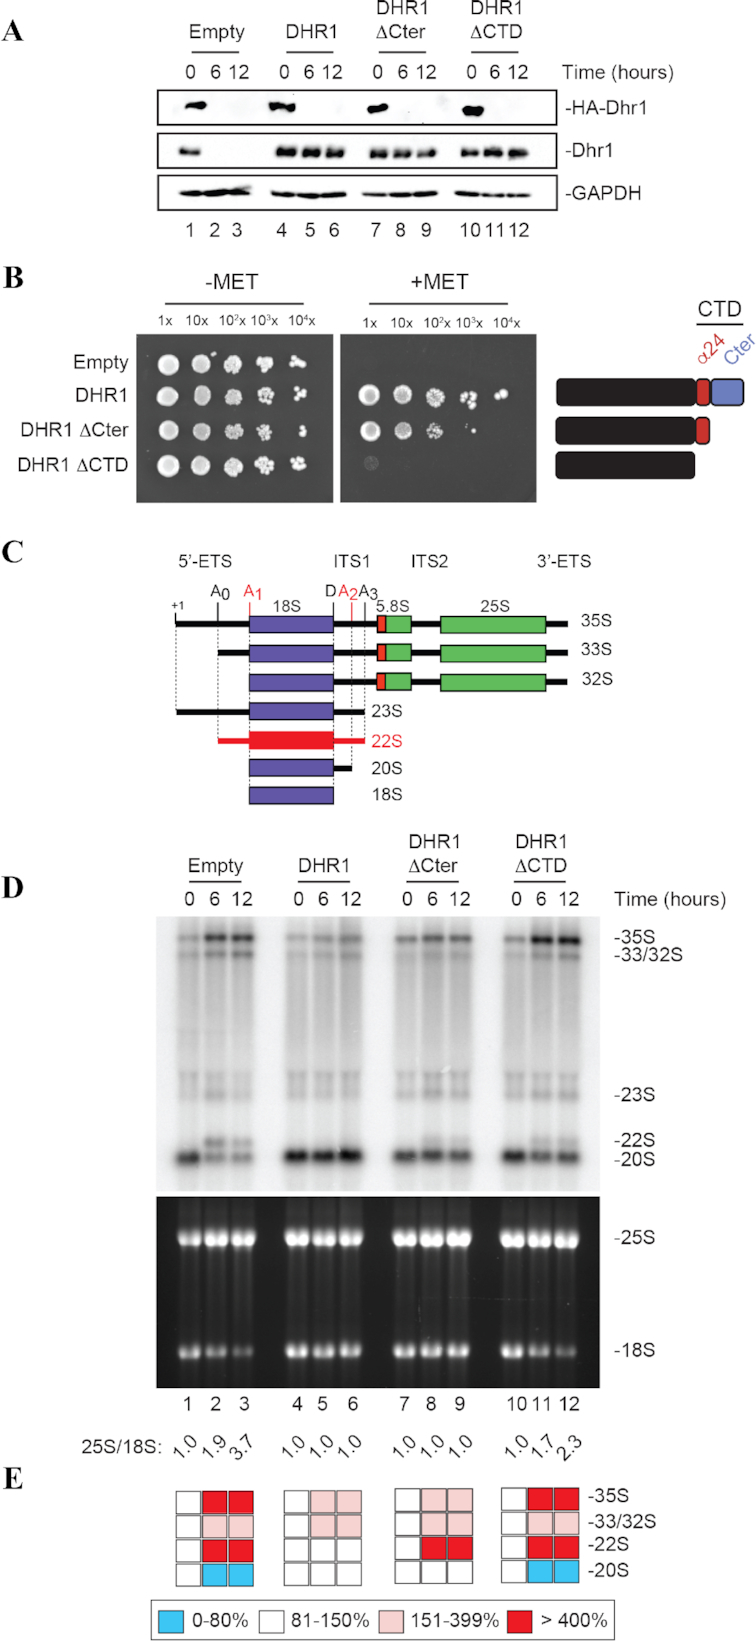
Figure 4.

The CTD of Dhr1 is required for cell growth and small ribosomal subunit biogenesis. (A) The two Dhr1 CTD truncations (Dhr1ΔCTD and Dhr1ΔCter) are stably expressed. Western blot analysis showing the progressive extinction of expression of endogenous HA-Dhr1, specifically detected with an anti-HA antibody (top panels), and the expression of the complementing wild-type Dhr1 and the two CTD mutants (middle panels, detection with an anti-Dhr1 antibody). As loading control, blots were probed for GAPDH. The experiments in panels A and D are showing a time course of transfer from a medium lacking methionine (0-h time points) to a medium containing methionine (6- and 12-h time points). (B) The Dhr1ΔCTD and Dhr1ΔCter truncations impact cell growth differentially. Serial dilutions of the indicated yeast strains were incubated on agar plates for 3 days at 30°C in the absence (–MET) or presence (+MET) of methionine. (C) Structure of the yeast primary transcript (35S), of precursors (33S, 32S, 23S, 20S) in the pathway of synthesis of the 18S rRNA, and of the aberrant 22S RNA, typically accumulated in dhr1 mutants. Three out of four mature rRNAs are produced from a single polycistronic transcript by processing. Cleavage sites important for 18S rRNA production (A0, A1, A2, A3 and D) are shown. The 22S RNA extending from site A0 to A3 is produced in the absence of cleavages at sites A1 and A2 (highlighted in red). (D) The two Dhr1 CTD truncations inhibit pre-rRNA processing with distinct degree of severity. Top, Northern blot analysis detecting major pre-rRNA species (indicated to the right, and see panel C). The probe used was specific to internal transcribed spacer 1 (ITS1) sequence (see Materials and Methods). Bottom, ethidium bromide-stained denaturing agarose gel showing the amounts of 18S and 25S rRNAs. The 25S/18S ratio established from bioanalyzer electropherogramms is indicated below the gels. (E) Quantification of panel D. Pre-rRNA processing intermediates were quantified with a Phosphor imager. Results are shown as a heat-map.
