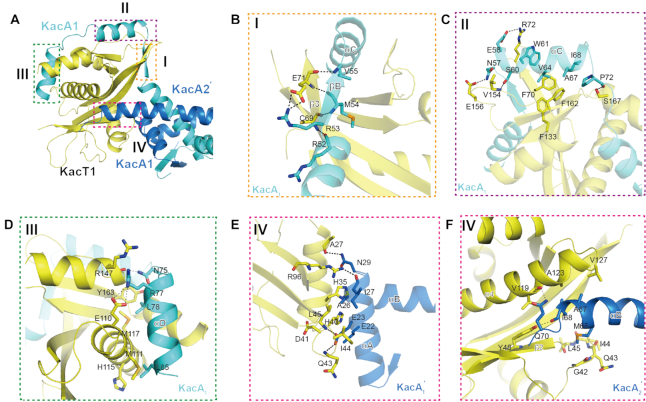
Figure 3.
Details of KacA–KacT interactions. (A) Overview of the KacT–KacA interactions within the KacA4T2 heterohexamer. The interactions between the KacT and KacA identified by dashed line boxes (I, II, III and IV) are detailed in panels (B–F). The residues forming the interfaces are drawn in stick representation and labelled in all figures. Colouring as in Figure 1. (B) Details of the interactions at binding site I, showing the interactions between KacT and KacA1 around the βB strand. (C) Details of the interactions at binding site II, showing the interactions between KacT and KacA1 around the αC helix. (D) Details of the interactions at binding site III, showing the AcCoA-binding site identified in the KacT Y145F structure. (E and F) Details of the interactions at binding site IV, showing the KacT dimer interface site identified in the KacT Y145F structure. Panel (E) is the close-up view of the interactions between KacT and KacA2′. Panel (F) is the close-up view of the interactions between KacT and KacA1′. Hydrogen bonds are indicated by black dashed lines.

