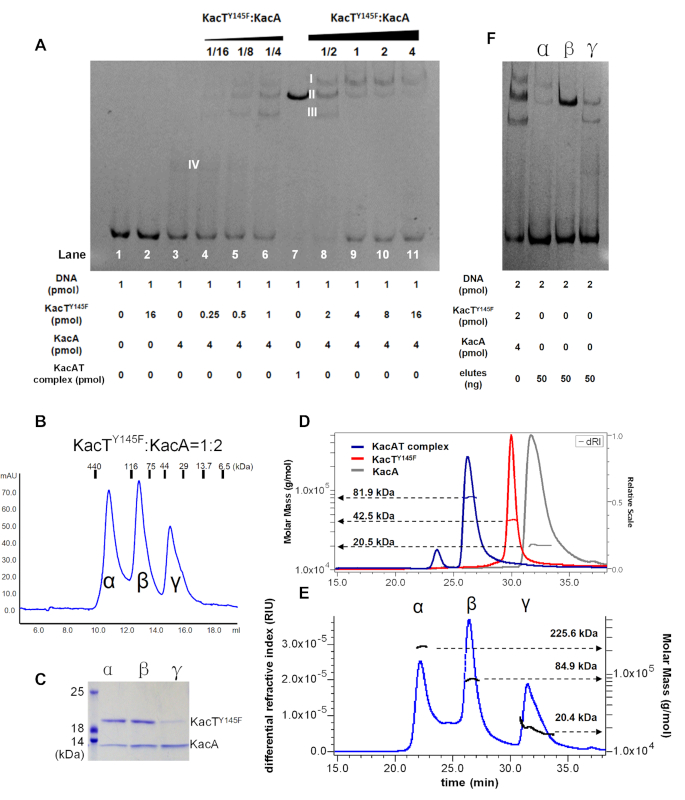
Figure 6.
Interplay between KacA, KacT and operator DNA. (A) EMSA test of PkacAT promoter DNA with fixed KacA and increasing concentration of KacTY145F. The four shifted DNA bands are marked with band I, II, III and IV, respectively. (B) Analytical gel filtration chromatography for the mixture of KacTY145F and KacA ([T]:[A] = 1/2) by using a Superdex Increase 200 10/300 size exclusion column. (C) SDS-PAGE of the component elutes from peak α, β and γ in the retention window indicated in panel (B). (D) SEC-MALS chromatogram of KacA, KacTY145F and KacTA complex. The chromatogram shows the refractive index signal of KacA (gry), KacTY145F (red) and TA-complex (blue) with the derived molar masses indicated by the horizontal lines. (E) SEC-MALS chromatogram of the mixture of KacTY145F and KacA ([T]:[A] = 1/2). The chromatogram shows the refractive index signal with three peaks, corresponding to peak α, β and γ in panel (B). (F) EMSA test of PkacAT promoter DNA with the component elutes from peak α, β and γ. The mixture of KacT145F and KacA ([T]:[A] = 1/2) was used as a control.

