Figure 7.

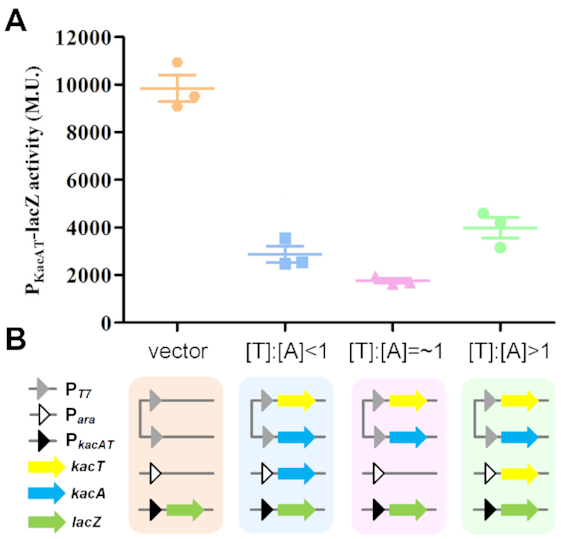
Transcription regulation analysis by lacZ fusions. (A) LacZ activities of strains harbouring PkacAT promoter-lacZ fusions in the presence of varied ratio of [KacT]:[KacA]. Enzymatic activities were determined 5 h after the addition of IPTG (0.5 mM) to induce kacA and arabinose (0.2%) to induce kacT. Data are presented as a scatterplot showing mean and standard error of three independent experiments. (B) Schematic representation of the expression of transcriptional reporter lacZ fusion subjected to regulation by the KacTA complex at varied ratios of [KacT:KacA]. Each coloured rectangle represents an E. coli BL21(DE3) cell harbouring three plasmids (more details available in Supplementary Figure S6), each of which is shown as a continuous line. Plasmid pLACZ-PkacAT (with the PkacAT promoter denoted by a black triangle) in BL21(DE3) together with the KacA and KacT expression plasmid pCDFDuet::kacT::kacA (both with PT7 promoters denoted by grey triangles) and pBAD33::kacA (with Para denoted by white triangle) or pBAD33::kacT (with Para), establishing the different [KacT]:[KacA] ratios in vivo.
