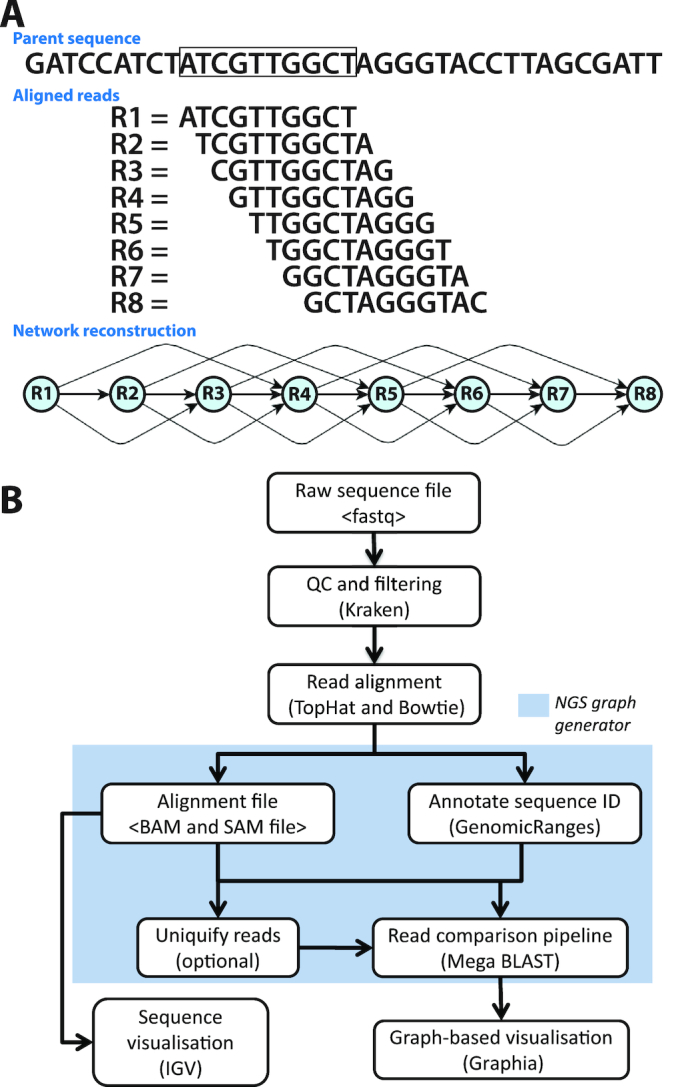
Figure 1.

Development of the analysis pipeline for visualization of RNA-Seq data. (A) Network paradigm for the analysis of short-read RNA-Seq data. A region of DNA is shown with 10 bp ‘reads’ aligned to it below. In this view, eight different reads position with a 1 bp consecutive offset to the parent sequence. If reads were compared and a threshold of ≥70% similarity were used to construct a graph, the network would have structure shown. (B) Pipeline for network-based visualization of RNA-Seq data. Analysis pipeline for building graphs from RNA-Seq data passes from raw sequencing FASTQ file through a series of analysis/annotation steps up to the production of a file for graph visualization within Graphia Professional.
