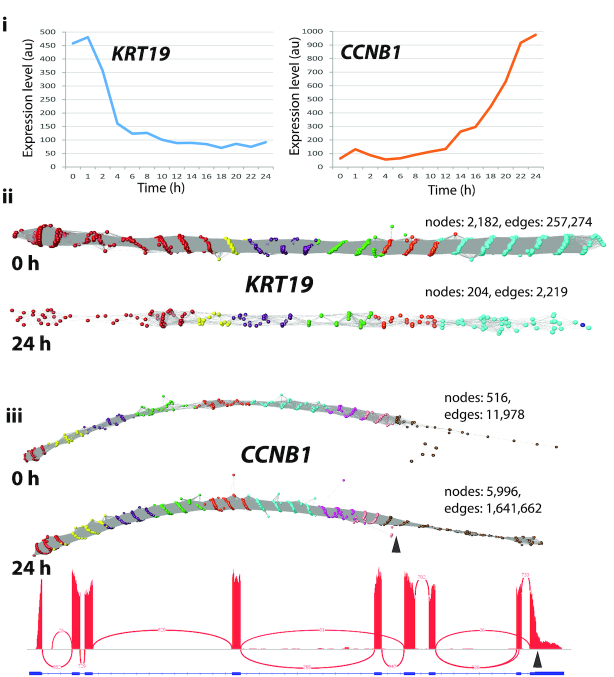
Figure 4.
Typical graphs of RNA-Seq data derived from linear transcripts. Examination of a wide range of RNA-Seq assembly graphs derived from human fibroblast expressed genes demonstrated that the majority of graphs are linear structures. Shown here are two such graphs for (ii)KRT19 and (iii)CCNB1 (node overlay colours representing exons were derived from ENST00000361566 and ENST00000256442, respectively). (i) Expression profile of the two genes as measured by microarray analysis of the time-course of transcriptional events following serum-refeeding (31). Expression of KRT19 is rapidly down-regulated whilst CCNB1 is up-regulated as the cells enter mitosis. This differential expression is evident from the graph visualization with the number of nodes decreasing or increasing by ∼10-fold in the 0 h derived versus the 24 h derived RNA-Seq data. It is interesting to note that in the CCNB1 graphs there is an abrupt decrease in the density of nodes within exon 9 at both time points (marked by arrow). This corresponds to where the IGV view also shows a decrease in the density of reads and corresponds to a CCNB1 transcript (ENST00000505500) that exhibits a truncated exon 9 at this position.

