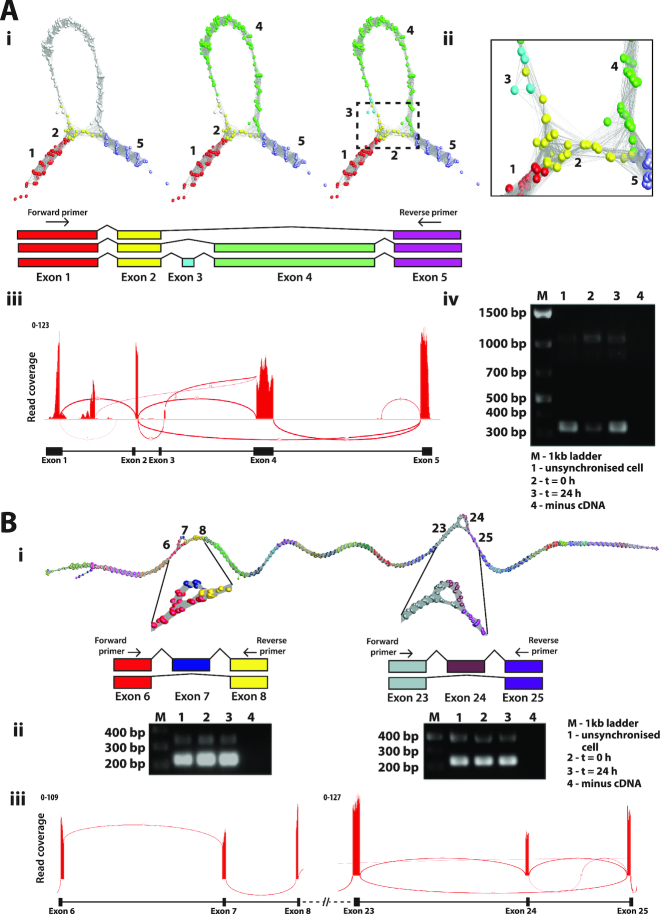
Figure 5.
Splice variant visualization and confirmation. (A) Splice variants of LRR1. (Ai) Loop in the LRR1 graph suggested that two or possibly three transcript isoforms are expressed in fibroblasts. These are shown overlaid on the graph together with a schematic representation of each isoform. (Aii) Close-up view of exon skipping event in LRR1 shows the connection of exon 2 (yellow nodes) to exon 5 (light purple nodes) skipping exons 3 and 4 (blue/green nodes). (Aiii) Sashimi plot generated in IGV showing RNA-Seq reads mapping to the LRR1 locus. Splice junctions are displayed as arcs connecting exons. The number of reads observed for each junction is indicated within segments, and y-axis ranges for the number of reads per exon base are shown. (Aiv) Result for RT-PCR of LRR1 mRNA using the human fibroblast RNA from the proliferation time course. Three bands showing on the gel represent alternatively spliced products due to exon 3/4 skipping (310 bp), exon 3 skipping (1022 bp) or the full transcript (1130 bp). The position of the PCR primers is shown in Ai. (B) Splice variants of PCM1. (Bi) Two different splicing events for PCM1 were evident from the graph visualization of this gene. (Bii) Result for RT-PCR of PCM1 for two different locations of splice variant using the human fibroblast RNA from the proliferation time-course. Skipping of exon 7 resulted in a PCR fragment size of 223 bp, compared with 339 bp when included, and skipping of exon 25 resulted in a PCR fragment of 331 bp compared with 496 bp when included. (Biii) Representative Sashimi plot generated in IGV.

