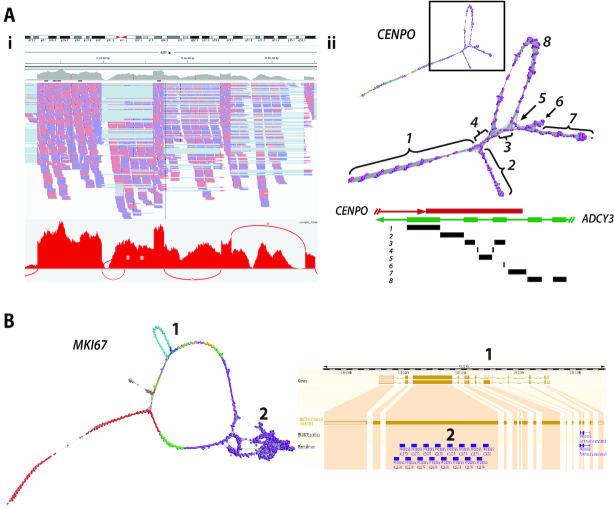
Figure 6.
Complex gene graph structure. (A) Mis-assembly of reads from overlapping genes. (Ai) IGV visualization of CENPO exon 8 together with corresponding Sashimi plot. ADCY3 overlaps with CENPO on the opposite strand of DNA. (Aii) In this case, reads derived from ADCY3 mRNA are being wrongly mapped to CENPO resulting in the complex graph structure observed in exon 8. The schematic diagram of overlapping genes CENPO and ACDY3 is shown above and regions of the graph mapped back to it. The loops in exon 8 of CENPO are formed by junction reads derived from ADCY3 encoded on the opposite strand. (B) Repeat sequences cause perturbation in graph structure. Network-based visualization of MKI67. In this graph, there are two structures: (1) an alternatively spliced exon and (2) internal duplication. Skipping of exon 6 giving rise to ENST00000368653 can be observed as the loop structure, whilst the knotted structure is formed due the presence of 16 K167/Chmadrin repeat domains within exon 12.

