Figure 7.
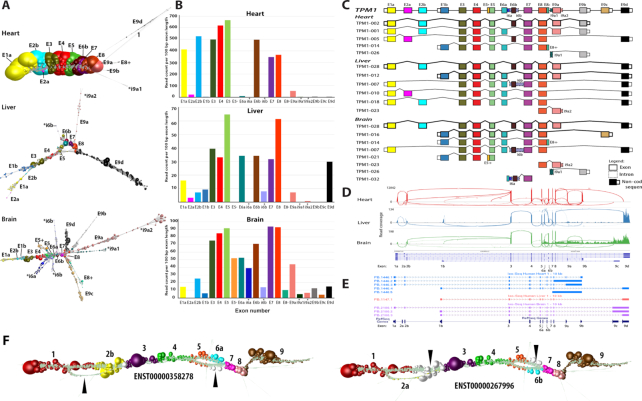
Graph visualization of TPM1 transcript isoforms expressed in different tissues. (A) Graph-based visualization of TPM1 mRNA from heart, liver and brain. In these graphs, node size reflects the relative read depth as shown in Figure 3. In the case of the heart, the TPM1 expression graph shows one major isoform while an estimated four other minor isoforms are observed that give rise to network ‘branches’. In the TPM1 graph generated from liver, all isoforms would appear to be expressed at the similar levels. Alternative 5′ transcript initiation can be visualized as the first two branches of the graph. The mutually exclusive exons 6a and 6b can be seen from the graph structure, while the retention intron of 6b and 9a is observed as a few nodes branching out from the core graph structure. The RNA assembly graph generated from brain demonstrates that multiple isoforms are expressed in this tissue, a complex series of branched structures emanating out from the graph at different locations. The observed structure is supported by Ensembl gene models. (B) Histogram of the number of reads per 100 bp of exon per sample. (C) Schematic representation of TPM1 transcript isoform diversity expressed in heart, liver and brain as interpreted from RNA assembly graphs. (D) Representative Sashimi plots generated in IGV showing RNA-Seq reads mapping to TPM1 locus in the different tissues. Height of the bars represents read coverage. Splice junctions are displayed as arcs, with the number of reads observed for each junction being indicated by line thickness. (E) UCSC Genome Browser sequence visualization of TPM1 gene from a different study of the whole human transcriptome of brain, heart and liver generated on the PacBio long-read platform. The number of isoforms detected by PacBio is different from the graph-based based visualization. PacBio detected five isoforms in heart (blue), one in liver (orange) and three in the brain (purple). (F) TPM1 graph as expressed in fibroblasts. Two bifurcation events are clearly visible in the graph that correspond to two isoforms of the transcript, ENST00000358278 and ENST00000267996. These exhibit two mutually exclusive exon splicing events, the former containing exons 2b and 6a and the latter containing exons 2a and 6b, the white nodes (arrows) corresponding to reads that do not map to the corresponding transcript.

