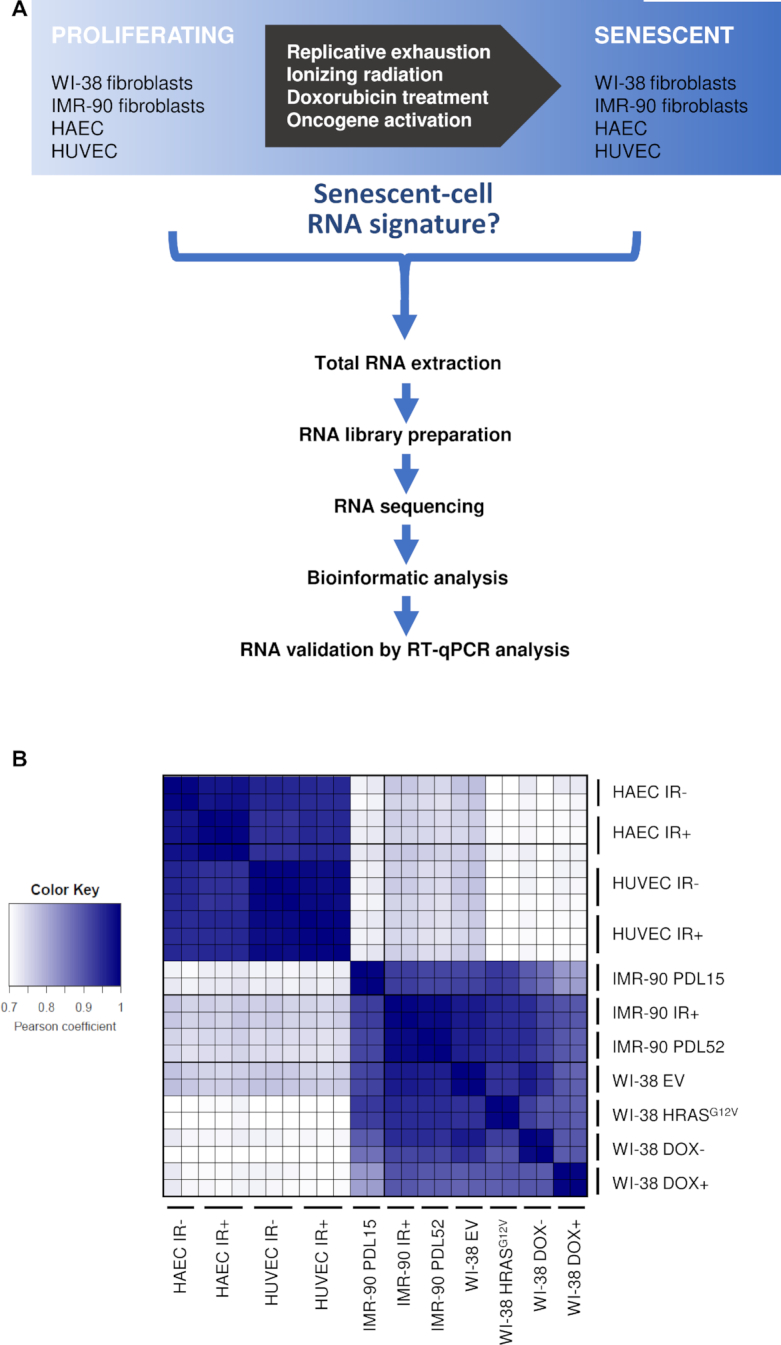
Figure 2.

Study workflow. (A) Schematic representation of the workflow to trigger senescence. (B) Heat map of Pearson correlation coefficients to compare correlations between the samples, calculated using the log counts per million (CPM) of all the mapped transcripts from RNA-seq, where 1 is total positive linear correlation between two samples and 0 is no linear correlation.
