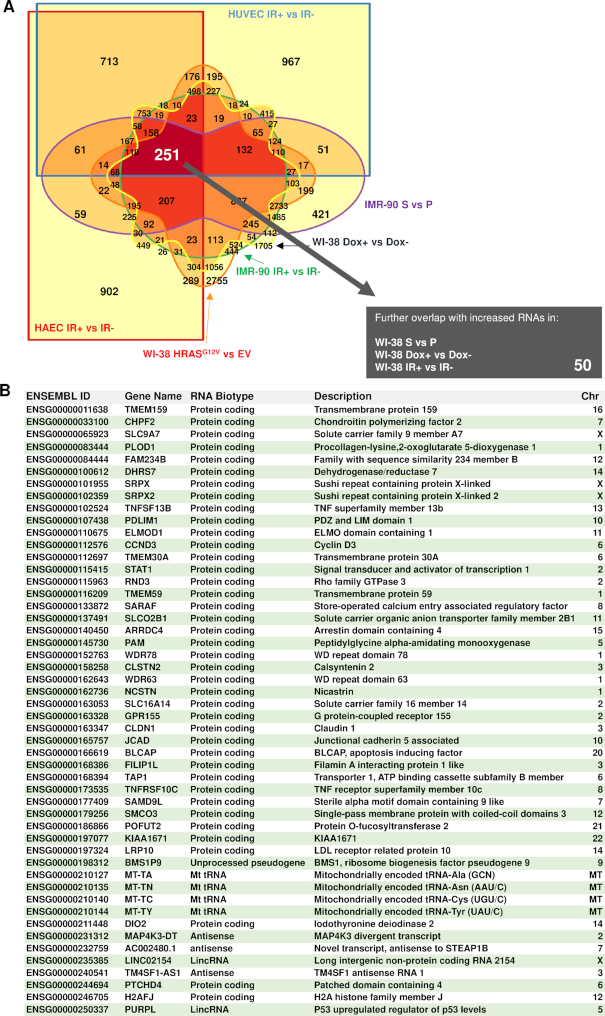
Figure 4.
Shared increased RNAs in senescence. (A) Venn diagram of all the possible overlapping and non-overlapping transcripts in six comparison groups sequenced together, showing increased abundance with senescence, filtering for a significance FDR < 0.15 (Benjamini–Hochberg P-value correction). Increasing color saturation indicates overlapping comparisons with largest number of RNAs; 251 RNAs were found to be upregulated in all six comparisons. (B) Table lists a final set of 50 increased transcripts, after overlapping those 251 RNAs with three additional comparison groups of elevated RNAs using the same significance adjustments in WI-38 S versus P, WI-38 Dox+ versus Dox- and WI-38 IR+ versus IR-.

