Figure 6.
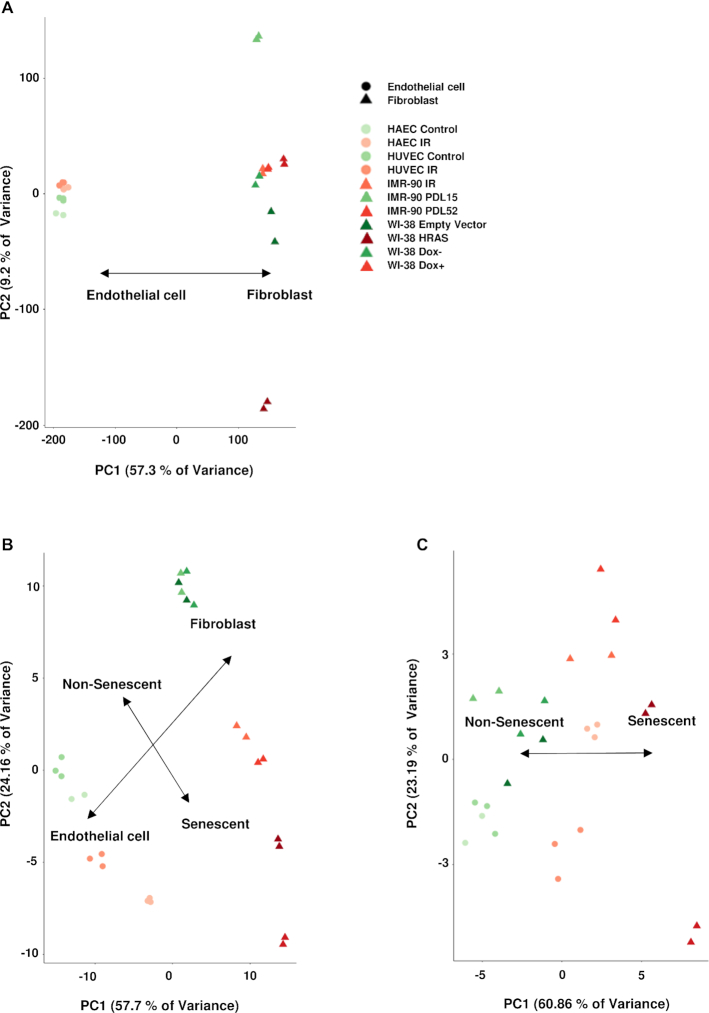
Senescence versus non-senescence discrimination. (A) Principal component analysis (PCA) calculated using the normalized log counts per million (CPM) of all aligned transcripts. (B) PCA of the same group of samples when considering only the 68 transcripts with shared reduced (18) or increased (50) expression in all models of senescence studied. (C) PCA of the same group of samples when only considering SLCO2B1, CLSTN2 and PTCHD4 mRNAs, as well as LINC02154 and PURPL lncRNAs in the analysis.

