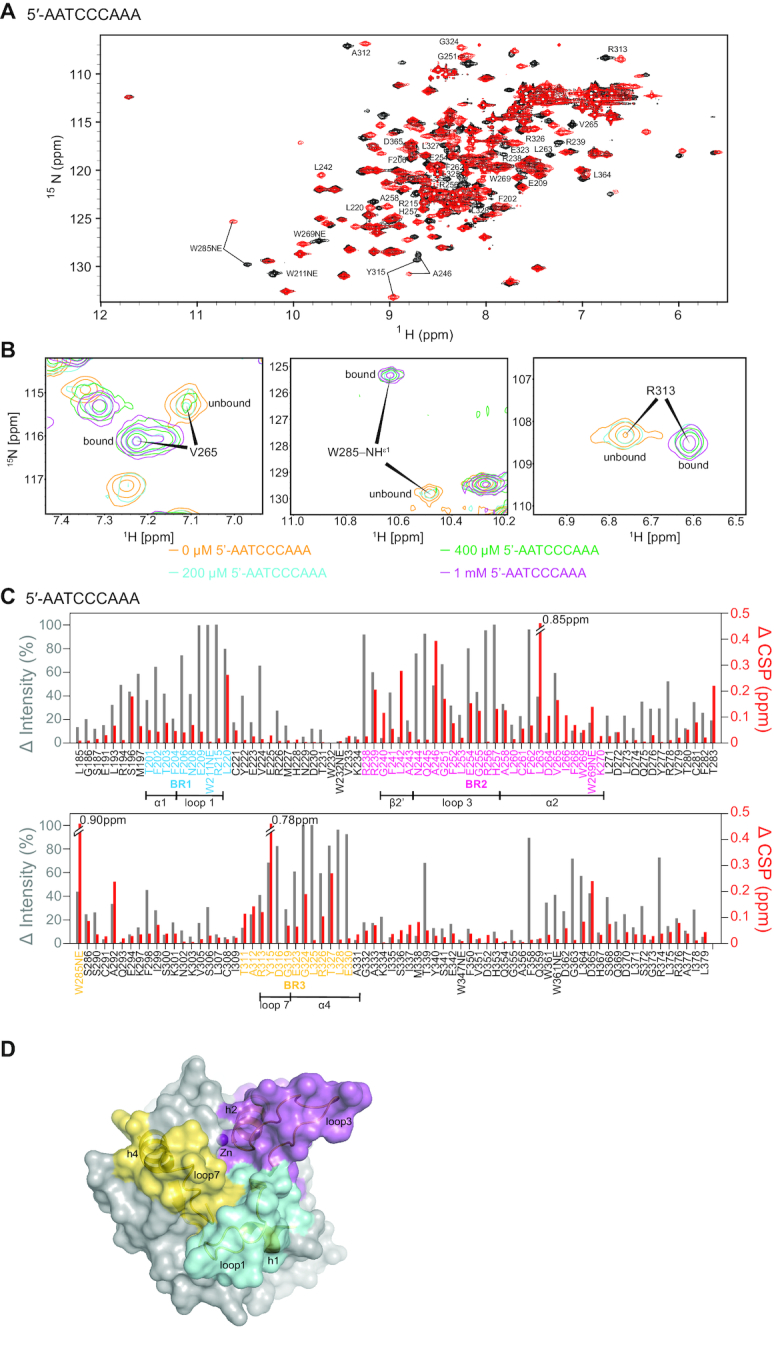
Figure 2.

Chemical shift perturbation and signal intensity changes upon binding 5′-AATCCCAAA. (A) 1H–15N HSQC spectrum of 0.2 mM A3Gctd-2K3A-E259A mixed with 1 mM 5′-AATCCCAAA (red) overlaid onto 0.2 mM A3Gctd-2K3A-E259A (black). Significantly shifted peaks are labeled. (B) NMR signals of residues in slow exchange regime upon addition of 5′-AATCCCAAA. DNA-unbound signals are labeled unbound, whereas DNA-bound signals are labeled bound. Intensities of unbound signals decrease, while intensities of bound signals increase, upon increment of the ssDNA concentration. (C) Quantification of peak intensity changes (gray bars, left axis) and chemical shifts changes (red bars, right axis). Residues in BR1, BR2 and BR3 are colored blue, magenta and yellow, respectively. Secondary structures within the binding regions are shown under the residues. (D) Three ssDNA binding regions are shown on the surface of the structure of ssDNA-free wild type A3Gctd (PDB ID# 4ROV). Binding region 1 (BR1, cyan) spans residues 201–220, binding region 2 (BR2, magenta) spans residues 238–270, and binding region 3 (BR3, yellow) spans the non-consecutive residues 285, 311–330. Secondary structures of binding regions are shown in cartoon models.
