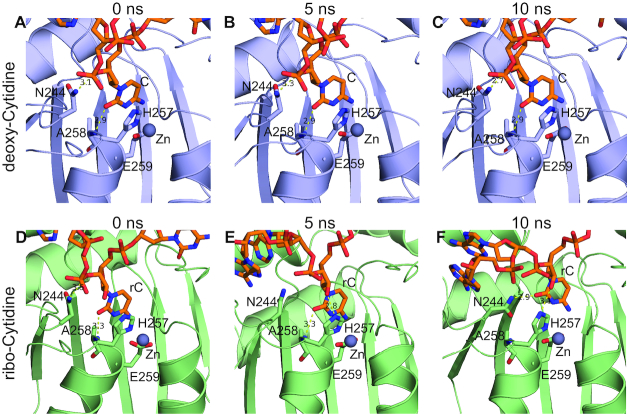
Figure 6.
Snapshots from MD simulations with deoxycytidine and ribocytidine. All panels display the expanded view of the catalytic site of A3Gctd. Zn2+ is shown as a gray sphere, and yellow dashed lines indicate possible hydrogen bonds. DNAs are shown in orange stick model, and nitrogen and oxygen atoms are colored blue and red, respectively. (A), (B) and (C) are snapshots of the 5′-TCCCAA and A3Gctd complex at 0, 5 and 10 ns time points, respectively, while (D), (E) and (F) are snapshots of the 5′-TCCrCAA and A3Gctd complex at 0, 5 and 10 ns time points, respectively.

