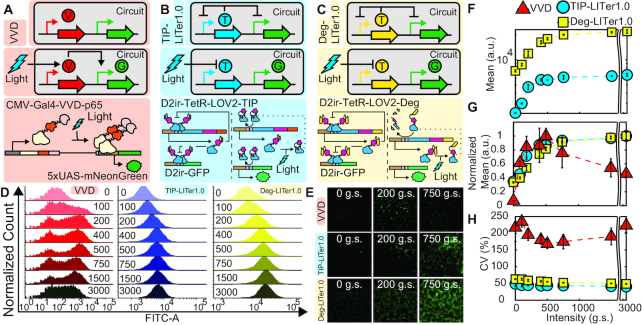
Figure 1.
Gene expression control by VVD, TIP-LITer1.0 and Deg-LITer1.0 gene circuits with constant illumination at increasing light intensities. (A-C) Simplified and detailed schematics of VVD (A), TIP-LITer1.0 (B) and Deg-LITer1.0 (C) gene circuits stably integrated within the Flp-In 293 cell genome. ‘V’ is the VVD protein, ‘T’ is the TetR regulator with either TIP or Degron and ‘G’ is the Reporter output. (D) Fluorescence histograms for flow cytometry performed for each gene circuit under light intensity titration. Numbers within graph represent grayscale value from LPA for stimulating constant light intensity. (E) Fluorescence microscopy of cells with corresponding gene circuits over light intensity titration. (F) Flow cytometry mean fluorescence versus light intensity titration for the LITer1.0 gene circuits. (G) Mean fluorescence values normalized by maximum fluorescence intensity for the three gene circuits. Error bars represent standard deviations; N = 3. (H) Coefficient of variation (CV) over light intensity titration for the three gene circuits. Two-sample t-test was performed on maximum and minimum mean fluorescence data values. TIP-LITer1.0 ON/OFF had a P-value of 3.21E-06, Deg-LITer1.0 ON/OFF had a P-value of 5.40E-10 and VVD ON/OFF had a P-value of 1.28E-04. Kruskal–Wallis test was performed for CV dataset differences. TIP-LITer1.0 versus VVD had a P-value of 2.87E-09 and Deg-LITer1.0 versus VVD had a P-value of 2.88E-09.

