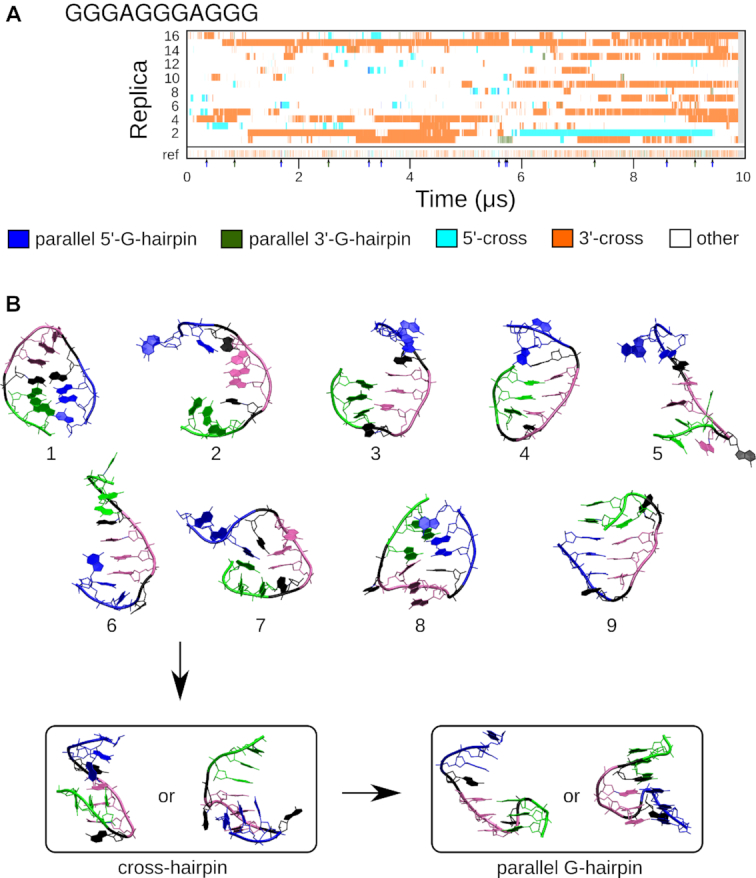
Figure 6.

(A) G-hairpin clusters populated in the REST2 GGGAGGGAGGG simulation. Each numbered line represents one continuous (demultiplexed, coordinate-following) replica; the discontinuous reference replica collecting the unbiased populations is at the bottom of the graph. Parallel G-hairpin occurrences in the reference replica are highlighted by arrows below the reference replica line. (B) G-hairpin folding pathways. Nine different structures that led to folding of parallel G-hairpin through cross-hairpin structures involving two G-tracts. The structures are briefly described in the text. The first G-tract is green, the second one is purple, the third one is blue and the loops are black.
